OPEN-SOURCE SCRIPT
%ATR + ΔClose Highlight
Script Overview
This indicator displays on your chart:
Table of the last N bars that passed the ATR-based range filter:
Columns: Bar #, High, Range (High–Low), Low
Summary row: ATR(N), suggested Stop-Loss (SL = X % of ATR), and the current bar’s range as a percentage of ATR
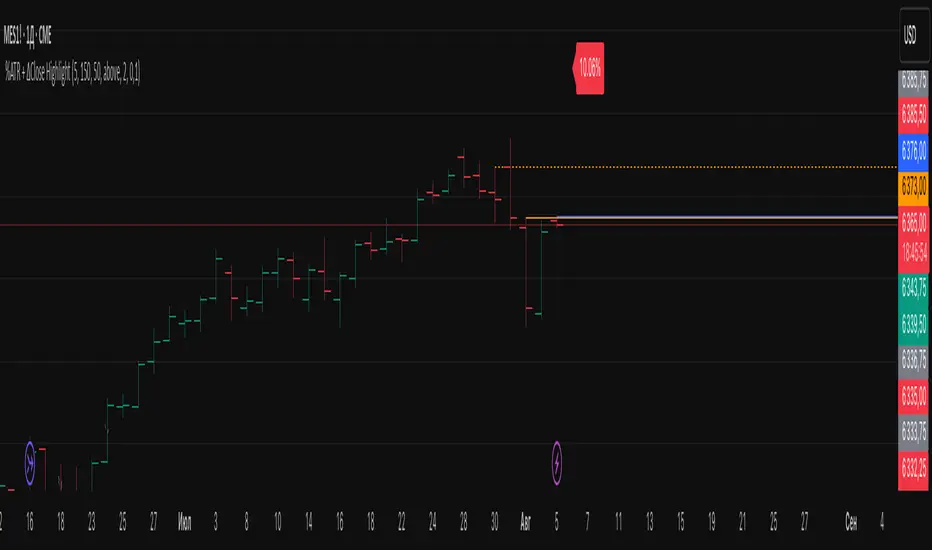
Red badge on the most recent bar showing ΔClose% (the absolute difference between today’s and yesterday’s close, expressed as % of ATR)
Background highlights:
Blue fill under the most recent bar that met the filter
Yellow fill under bars that failed the filter
Hidden plots of ATR, %ATR, and ΔClose% (for use in strategies or alerts)
All table elements, fills, and plots can be toggled off with a single switch so that only the red ΔClose% badge remains visible.
Inputs
Setting Description Default
Length (bars) Lookback period for ATR and range filter (bars) 5
Upper deviation (%) Upper filter threshold (% of average ATR) 150%
Lower deviation (%) Lower filter threshold (% of average ATR) 50%
SL as % of ATR Stop-loss distance (% of ATR) 10%
Label position Table position relative to bar (“above” or “below”) above
Vertical offset (×ATR) Vertical spacing from the bar in ATR units 2.0
Show table & ATR plots Show or hide table, background highlights, and plots true
How It Works
ATR Calculation & Filtering
Computes average True Range over the last N bars.
Marks bars whose daily range falls within the specified upper/lower deviation band.
Table Construction
Gathers up to N most recent bars that passed the filter (or backfills from the most recent pass).
Formats each bar’s High, Low, and Range into fixed-width columns for neat alignment.
Stop-Loss & Percent Metrics
Calculates a recommended SL distance as a percentage of ATR.
Computes today’s bar range and ΔClose (absolute change in close) as % of ATR.
Chart Display
Table: Shows detailed per-bar data and summary metrics.
Background fills: Blue for the latest valid bar, yellow for invalid bars.
Hidden plots: ATR, %ATR, and ΔClose% (useful for backtesting).
Red badge: Always visible on the right side of the last bar, displaying ΔClose%.
Tips
Disable the table & ATR plots to reduce chart clutter—leave only the red ΔClose% badge for a minimalist volatility alert.
Use the hidden ATR fields (plot outputs) in TradingView Strategies or Alerts to automate volatility-based entries/exits.
Adjust the deviation band to capture “normal” intraday moves vs. outsized volatility spikes.
Load this script on any US market chart (stocks, futures, crypto, etc.) to instantly visualize recent volatility structure, set dynamic SL levels, and highlight today’s price change relative to average true range.
This indicator displays on your chart:
Table of the last N bars that passed the ATR-based range filter:
Columns: Bar #, High, Range (High–Low), Low
Summary row: ATR(N), suggested Stop-Loss (SL = X % of ATR), and the current bar’s range as a percentage of ATR
Red badge on the most recent bar showing ΔClose% (the absolute difference between today’s and yesterday’s close, expressed as % of ATR)
Background highlights:
Blue fill under the most recent bar that met the filter
Yellow fill under bars that failed the filter
Hidden plots of ATR, %ATR, and ΔClose% (for use in strategies or alerts)
All table elements, fills, and plots can be toggled off with a single switch so that only the red ΔClose% badge remains visible.
Inputs
Setting Description Default
Length (bars) Lookback period for ATR and range filter (bars) 5
Upper deviation (%) Upper filter threshold (% of average ATR) 150%
Lower deviation (%) Lower filter threshold (% of average ATR) 50%
SL as % of ATR Stop-loss distance (% of ATR) 10%
Label position Table position relative to bar (“above” or “below”) above
Vertical offset (×ATR) Vertical spacing from the bar in ATR units 2.0
Show table & ATR plots Show or hide table, background highlights, and plots true
How It Works
ATR Calculation & Filtering
Computes average True Range over the last N bars.
Marks bars whose daily range falls within the specified upper/lower deviation band.
Table Construction
Gathers up to N most recent bars that passed the filter (or backfills from the most recent pass).
Formats each bar’s High, Low, and Range into fixed-width columns for neat alignment.
Stop-Loss & Percent Metrics
Calculates a recommended SL distance as a percentage of ATR.
Computes today’s bar range and ΔClose (absolute change in close) as % of ATR.
Chart Display
Table: Shows detailed per-bar data and summary metrics.
Background fills: Blue for the latest valid bar, yellow for invalid bars.
Hidden plots: ATR, %ATR, and ΔClose% (useful for backtesting).
Red badge: Always visible on the right side of the last bar, displaying ΔClose%.
Tips
Disable the table & ATR plots to reduce chart clutter—leave only the red ΔClose% badge for a minimalist volatility alert.
Use the hidden ATR fields (plot outputs) in TradingView Strategies or Alerts to automate volatility-based entries/exits.
Adjust the deviation band to capture “normal” intraday moves vs. outsized volatility spikes.
Load this script on any US market chart (stocks, futures, crypto, etc.) to instantly visualize recent volatility structure, set dynamic SL levels, and highlight today’s price change relative to average true range.
오픈 소스 스크립트
트레이딩뷰의 진정한 정신에 따라, 이 스크립트의 작성자는 이를 오픈소스로 공개하여 트레이더들이 기능을 검토하고 검증할 수 있도록 했습니다. 작성자에게 찬사를 보냅니다! 이 코드는 무료로 사용할 수 있지만, 코드를 재게시하는 경우 하우스 룰이 적용된다는 점을 기억하세요.
면책사항
해당 정보와 게시물은 금융, 투자, 트레이딩 또는 기타 유형의 조언이나 권장 사항으로 간주되지 않으며, 트레이딩뷰에서 제공하거나 보증하는 것이 아닙니다. 자세한 내용은 이용 약관을 참조하세요.
오픈 소스 스크립트
트레이딩뷰의 진정한 정신에 따라, 이 스크립트의 작성자는 이를 오픈소스로 공개하여 트레이더들이 기능을 검토하고 검증할 수 있도록 했습니다. 작성자에게 찬사를 보냅니다! 이 코드는 무료로 사용할 수 있지만, 코드를 재게시하는 경우 하우스 룰이 적용된다는 점을 기억하세요.
면책사항
해당 정보와 게시물은 금융, 투자, 트레이딩 또는 기타 유형의 조언이나 권장 사항으로 간주되지 않으며, 트레이딩뷰에서 제공하거나 보증하는 것이 아닙니다. 자세한 내용은 이용 약관을 참조하세요.