OPEN-SOURCE SCRIPT
업데이트됨 The Rush
█ OVERVIEW
This script shows when buyers are in a rush to buy and when sellers are in a rush to sell
═════════════════════════════════════════════════════════════════════════
█ CONCEPTS
Prophet Mohamed Peace be upon Him once said something similar to this "It is not advisable to trade if you do not know the
Volume".
In his book "The Day Trader's Bible - Or My Secret In Day trading Of Stocks", Richard D. Kickoff wrote in page 55
"This shows that there was only 100 shares for sale at 180 1/8, none at all at 180f^, and only 500 at 3/8. The jump from 1 to 8 to 3/8
Emphasizes both the absence of pressure and persistency on the part of the buyers. They are not content to wait patiently until they can
Secure the stock at 180^/4; they "reach" for it."
This script was inspired by these two great men.
Prophet Mohamed Peace be upon Him showed the importance of the volume and Richard D. Kickoff explained what Prophet
Mohamed Peace be upon Him meant.
So I created this script that gauge the movement of the stock and the sentiments of the traders.
═════════════════════════════════════════════════════════════════════════
• FEATURES: The script calculates The Percentage Difference of the price and The Percentage Difference of the volume between
two success bullish candles (or two success bearish candles) and then it creates a ratio between these two Percentage
Differences and in the end the ratio is compared to the previous one to see if there is an increase or a decrease.
═════════════════════════════════════════════════════════════════════════
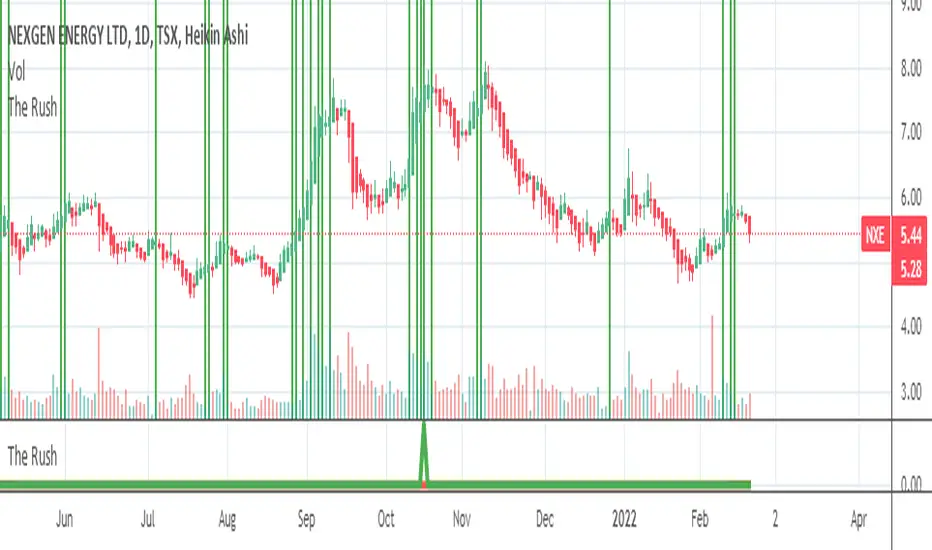
• HOW TO USE: if you see 2 or more successive red bars that mean bears are in hurry to sell and you can expect a bearish trend soon
if the Market Maker allows it or later if the Market Maker wants to do some distribution.
if you see 2 or more successive green bars that mean bulls are in hurry to buy and you can expect a bullish trend soon if the Market
Maker allows it or later if the Market Maker wants to do some accumulation.
═════════════════════════════════════════════════════════════════════════
• LIMITATIONS:
1- Use only Heikin Ashi chart
2- Good only if volume data is correct , meaning good for a centralized Market. (You can use it for forex or
crypto but at your own risk because those markets are not centralized)
═════════════════════════════════════════════════════════════════════════
• THANKS: I pay homage to Prophet Mohamed Peace be upon Him and Richard D. Kickoff who inspired the creation of this
Script.
═════════════════════════════════════════════════════════════════════════
릴리즈 노트
Typo mistake Richard D. Kickoff is Richard D. Wyckoff a great trader릴리즈 노트
Elimination of the small signals 릴리즈 노트
1- Regular Bar candle can be also be used • HOW TO USE: if you see red line of value equal -75 or less that mean bears are in hurry to sell and you can expect a bearish trend soon
if the Market Maker allows it or later if the Market Maker wants to do some distribution.
if you see green line of value equal 75 or more that mean bulls are in hurry to buy and you can expect a bullish trend soon if the Market
Maker allows it or later if the Market Maker wants to do some accumulation.
릴리즈 노트
1- Regular Bar candle chart can be also be used with some time frames otherwise use Heikin Ashi chart릴리즈 노트
the modification that was made to eliminate weak signals was not appreciated so here is the original version오픈 소스 스크립트
트레이딩뷰의 진정한 정신에 따라, 이 스크립트의 작성자는 이를 오픈소스로 공개하여 트레이더들이 기능을 검토하고 검증할 수 있도록 했습니다. 작성자에게 찬사를 보냅니다! 이 코드는 무료로 사용할 수 있지만, 코드를 재게시하는 경우 하우스 룰이 적용된다는 점을 기억하세요.
면책사항
해당 정보와 게시물은 금융, 투자, 트레이딩 또는 기타 유형의 조언이나 권장 사항으로 간주되지 않으며, 트레이딩뷰에서 제공하거나 보증하는 것이 아닙니다. 자세한 내용은 이용 약관을 참조하세요.
오픈 소스 스크립트
트레이딩뷰의 진정한 정신에 따라, 이 스크립트의 작성자는 이를 오픈소스로 공개하여 트레이더들이 기능을 검토하고 검증할 수 있도록 했습니다. 작성자에게 찬사를 보냅니다! 이 코드는 무료로 사용할 수 있지만, 코드를 재게시하는 경우 하우스 룰이 적용된다는 점을 기억하세요.
면책사항
해당 정보와 게시물은 금융, 투자, 트레이딩 또는 기타 유형의 조언이나 권장 사항으로 간주되지 않으며, 트레이딩뷰에서 제공하거나 보증하는 것이 아닙니다. 자세한 내용은 이용 약관을 참조하세요.