OPEN-SOURCE SCRIPT
업데이트됨 [blackcat] L1 Institutional Golden Bottom Indicator
█ OVERVIEW
The script "[blackcat] L1 Institutional Golden Bottom Indicator" is an indicator designed to identify potential institutional buying interest or a "golden bottom" in the market. It calculates a series of values based on price movements and plots them on a chart to help traders make informed decisions.
█ LOGICAL FRAMEWORK
The script is structured into several main sections:
1 — Function Definitions: Custom functions xsa and calculate_institutional_golden_bottom are defined.
2 — Input Parameters: The user can set a threshold value for institutional interest.
3 — Calculations: The script calculates various indicators and conditions, including the institutional buy signal.
4 — Plotting: The results of the calculations are plotted on the chart.
5 — Labeling: When a golden bottom is detected, a label is placed on the chart.
The flow of data starts with the input parameters, proceeds through the calculation functions, and finally results in plotted outputs and labels.
█ CUSTOM FUNCTIONS
1 — xsa(src, len, wei)
• Purpose: To calculate a weighted moving average.
• Parameters:
– src: Source data (e.g., price).
– len: Length of the moving average.
– wei: Weighting factor.
• Return Value: The calculated weighted moving average.
2 — calculate_institutional_golden_bottom(close, high, low, threshold)
• Purpose: To determine the institutional golden bottom indicator.
• Parameters:
– close: Closing price.
– high: Highest price.
– low: Lowest price.
– threshold: User-defined threshold for institutional interest. By tuning the threshold value the user can properly identify the institutional golden bottom of the instrument. So, I can say this parameter is used to tune the "sensitivity" of this indicator.
• Return Value: An array containing the institutional indicator, golden bottom signal, and additional values (a1, b1, c1, d1).
█ KEY POINTS AND TECHNIQUES
• Weighted Moving Average (WMA): The xsa function implements a weighted moving average, which is useful for smoothing price data.
• Crossover Detection: The script uses a crossover condition to detect when the institutional indicator crosses above the threshold, indicating a potential buying opportunity.
• Conditional Logic: The script includes conditional statements to control the output of certain values only when specific conditions are met.
• Plotting and Labeling: The script uses plot and label.new functions to visualize the indicator and highlight significant events on the chart.
█ EXTENDED KNOWLEDGE AND APPLICATIONS
• Modifications: The script could be enhanced by adding more customizable parameters, such as different lengths for the moving averages or additional conditions for the golden bottom signal.
• Extensions: Similar techniques could be applied to other types of indicators, such as momentum oscillators or trend-following systems to identify market turning points.
• Related Concepts: Understanding weighted moving averages, crossover signals, and conditional plotting in Pine Script would be beneficial for enhancing this script and applying similar logic to other trading strategies.
릴리즈 노트
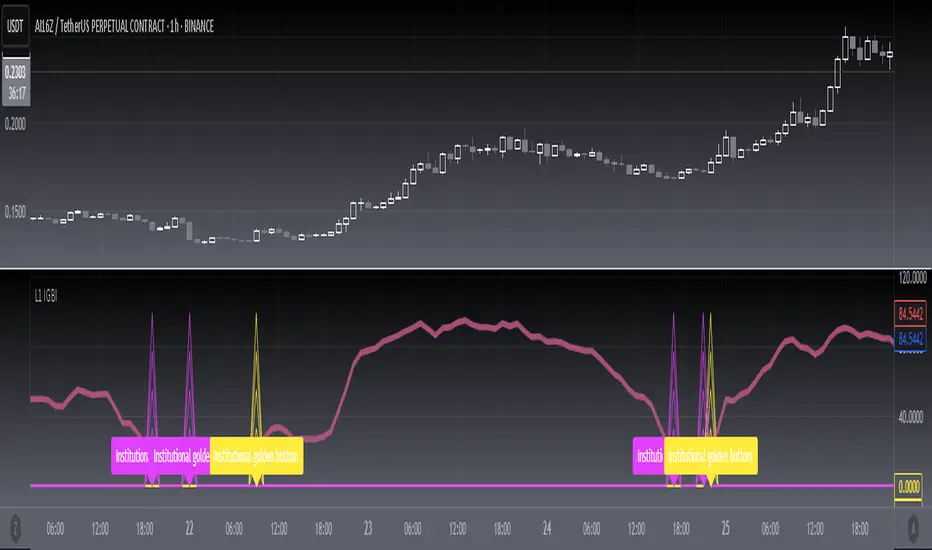
OVERVIEWThe [blackcat] L1 Institutional Golden Bottom and Top Indicator helps traders identify potential reversal points in the market by analyzing institutional activity. This script calculates various indicators based on weighted sums and institutional strength, providing clear signals for both bullish ('Golden Bottom') and bearish ('Golden Top') reversals. By plotting these values on a separate pane, users can easily visualize key turning points 📉↗️.
FEATURES
Calculates Institutional Strength using weighted sum averages:
Analyzes close prices relative to recent highs and lows.
Provides insights into institutional buying or selling pressure.
Identifies Golden Bottom and Golden Top signals:
Golden Bottom: Indicates potential bullish reversals with yellow lines and labels.
Golden Top: Indicates potential bearish reversals with fuchsia lines and labels.
Plots multiple indicators for better context:
Institutional Strength: Blue line for bottom, red line for top.
Additional indicators (A, B, C, D) plotted in corresponding colors.
Displays clear labels on the chart when conditions are met for easy identification 🏷️
HOW TO USE
Add the indicator to your TradingView chart by selecting it from the indicators list.
Adjust the Institution Threshold parameter to fine-tune sensitivity ⚙️.
Monitor the separate pane for Golden Bottom and Golden Top signals.
Use the plotted lines and labels as visual cues for potential trend changes.
Combine this indicator with other forms of analysis for more reliable trading decisions.
LIMITATIONS
The indicator may generate false signals in highly volatile or ranging markets 🌪️.
Users should always confirm signals with other technical tools before making trading decisions.
The effectiveness of the indicator may vary depending on the asset and timeframe being analyzed.
NOTES
Ensure that you have sufficient historical data available for accurate calculations.
Test the indicator thoroughly on demo accounts before applying it to live trading 🔍.
Customize the appearance and parameters as needed to fit your trading strategy.
오픈 소스 스크립트
트레이딩뷰의 진정한 정신에 따라, 이 스크립트의 작성자는 이를 오픈소스로 공개하여 트레이더들이 기능을 검토하고 검증할 수 있도록 했습니다. 작성자에게 찬사를 보냅니다! 이 코드는 무료로 사용할 수 있지만, 코드를 재게시하는 경우 하우스 룰이 적용된다는 점을 기억하세요.
Avoid losing contact!Don't miss out! The first and most important thing to do is to join my Discord chat now! Click here to start your adventure: discord.com/invite/ZTGpQJq 防止失联,请立即行动,加入本猫聊天群: discord.com/invite/ZTGpQJq
면책사항
해당 정보와 게시물은 금융, 투자, 트레이딩 또는 기타 유형의 조언이나 권장 사항으로 간주되지 않으며, 트레이딩뷰에서 제공하거나 보증하는 것이 아닙니다. 자세한 내용은 이용 약관을 참조하세요.