OPEN-SOURCE SCRIPT
Sector RSI (Auto-Select)
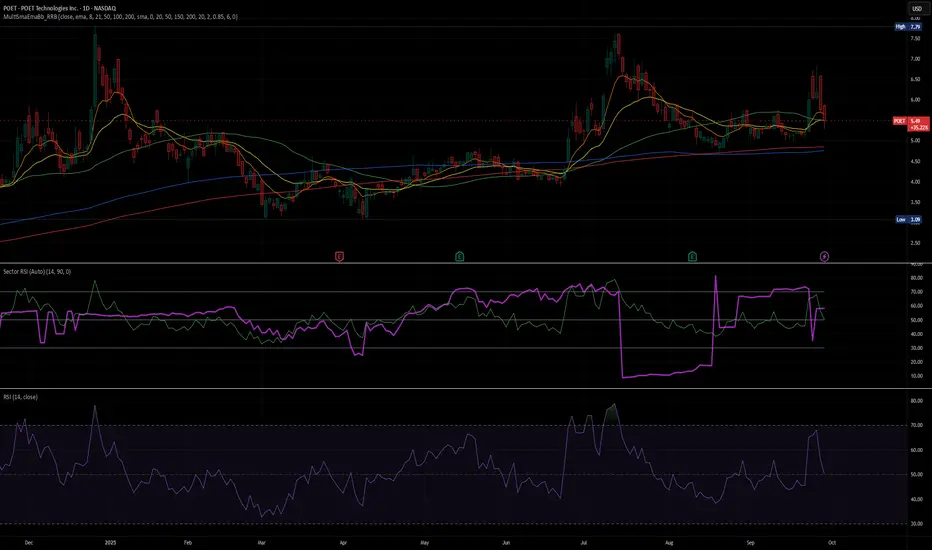
This indicator measures the relative strength momentum of any stock against its most closely correlated sector ETF, using the Relative Strength Index (RSI).
Auto sector selection: The script computes correlations between your symbol’s short-term returns and all major SPDR sector ETFs (XLB, XLE, XLF, XLI, XLK, XLP, XLU, XLV, XLY, XTN). The sector with the highest correlation is automatically chosen as the benchmark.
Sector vs Symbol RSI: It calculates RSI (default 14-period) for both the chosen sector and the current chart’s symbol.
Display modes:
Line mode: Plots both RSIs with colored fill (red if the sector RSI is stronger, green if the symbol RSI is stronger).
Histogram mode: Shows the difference between Sector RSI and Symbol RSI as a column chart.
RSI bands: Standard 70/50/30 reference lines are available in line mode.
Status line: The selected sector’s ticker is shown on the TradingView status line so you always know which sector is being used.
Use Cases:
Identify whether a stock’s momentum is driven by its sector or if it’s showing independent relative strength.
Detect sector rotations: when the stock begins to outperform or underperform its sector on momentum basis.
Combine with absolute RSI levels (overbought/oversold) to filter signals.
Notes:
This tool infers sector membership via rolling correlation, not from static classification metadata. This means in some cases (e.g. diversified companies or news shocks) the “best” sector may not be the official one, but the one most correlated in the current market regime.
Use min positive correlation input to filter out weak matches and enforce a fallback (defaults to Technology XLK).
오픈 소스 스크립트
트레이딩뷰의 진정한 정신에 따라, 이 스크립트의 작성자는 이를 오픈소스로 공개하여 트레이더들이 기능을 검토하고 검증할 수 있도록 했습니다. 작성자에게 찬사를 보냅니다! 이 코드는 무료로 사용할 수 있지만, 코드를 재게시하는 경우 하우스 룰이 적용된다는 점을 기억하세요.
면책사항
해당 정보와 게시물은 금융, 투자, 트레이딩 또는 기타 유형의 조언이나 권장 사항으로 간주되지 않으며, 트레이딩뷰에서 제공하거나 보증하는 것이 아닙니다. 자세한 내용은 이용 약관을 참조하세요.
오픈 소스 스크립트
트레이딩뷰의 진정한 정신에 따라, 이 스크립트의 작성자는 이를 오픈소스로 공개하여 트레이더들이 기능을 검토하고 검증할 수 있도록 했습니다. 작성자에게 찬사를 보냅니다! 이 코드는 무료로 사용할 수 있지만, 코드를 재게시하는 경우 하우스 룰이 적용된다는 점을 기억하세요.
면책사항
해당 정보와 게시물은 금융, 투자, 트레이딩 또는 기타 유형의 조언이나 권장 사항으로 간주되지 않으며, 트레이딩뷰에서 제공하거나 보증하는 것이 아닙니다. 자세한 내용은 이용 약관을 참조하세요.