OPEN-SOURCE SCRIPT
Candle Strength Analysis

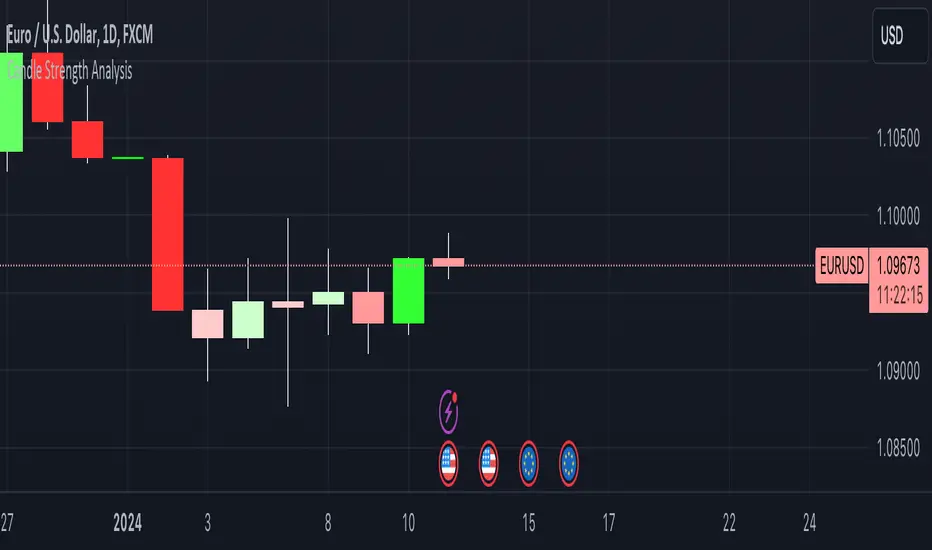
View candles differently with this new indicator designed to simply visualise and analyse price movements on your chart!
The more vibrant the colour, the stronger the conviction of its respective candle.
This simple script calculates the closing price as a percentage within the candles high/low range. A colour/strength rating is then assigned to the candle based on where this close price sits within the range.
Strong coloured candles occur when the close is very close to a high or low.
User defined percentage and colour inputs allow for quick personalisation and flexibility.
An additional wick imbalance feature identifies when a candle has a larger wick than its body, which may be used to identify a ranging market or shift in trader sentiment.
For any questions, concerns, or requests, please reach out to me in the comments below.
- The Pine Guru
오픈 소스 스크립트
트레이딩뷰의 진정한 정신에 따라, 이 스크립트의 작성자는 이를 오픈소스로 공개하여 트레이더들이 기능을 검토하고 검증할 수 있도록 했습니다. 작성자에게 찬사를 보냅니다! 이 코드는 무료로 사용할 수 있지만, 코드를 재게시하는 경우 하우스 룰이 적용된다는 점을 기억하세요.
면책사항
해당 정보와 게시물은 금융, 투자, 트레이딩 또는 기타 유형의 조언이나 권장 사항으로 간주되지 않으며, 트레이딩뷰에서 제공하거나 보증하는 것이 아닙니다. 자세한 내용은 이용 약관을 참조하세요.
오픈 소스 스크립트
트레이딩뷰의 진정한 정신에 따라, 이 스크립트의 작성자는 이를 오픈소스로 공개하여 트레이더들이 기능을 검토하고 검증할 수 있도록 했습니다. 작성자에게 찬사를 보냅니다! 이 코드는 무료로 사용할 수 있지만, 코드를 재게시하는 경우 하우스 룰이 적용된다는 점을 기억하세요.
면책사항
해당 정보와 게시물은 금융, 투자, 트레이딩 또는 기타 유형의 조언이나 권장 사항으로 간주되지 않으며, 트레이딩뷰에서 제공하거나 보증하는 것이 아닙니다. 자세한 내용은 이용 약관을 참조하세요.