PROTECTED SOURCE SCRIPT
Moving Average for Multiple Timeframes (on 1hr chart)
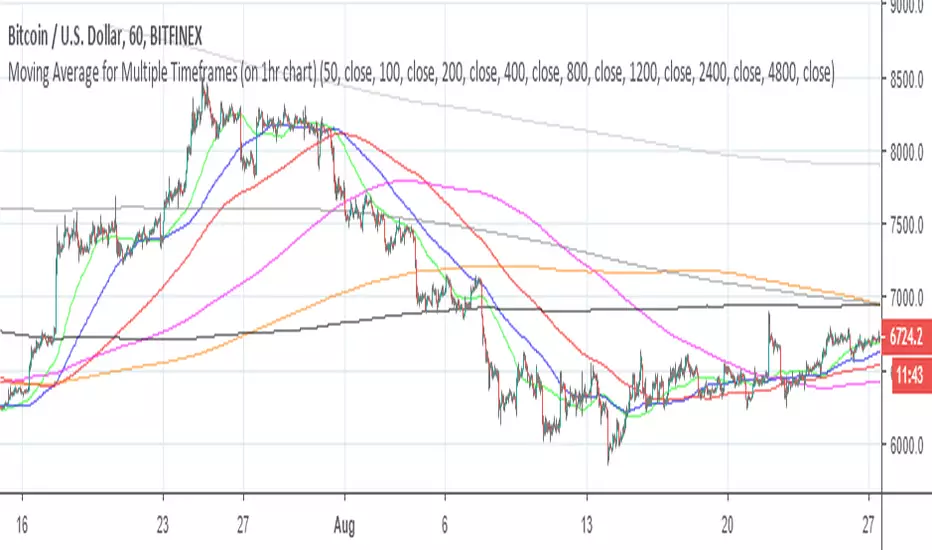
Free to use indicator that displays the 50, 100 and 200 Moving Average for 1 hour, 2 hour, 4 hour and 1 day time frames all at the same time (as long as you are on the 1 hour chart view)
What is a Moving Average?
Smooths out the price across each period to reveal short, medium and long term trends and their relationship to each other. Moving averages can often be expected to act as lines of support and resistance, better allowing you to predict where a price move might stop or falter. The higher the moving average time frame the more significant the support/resistance will be.
Why is this indicator different from other Moving Average scripts?
Usually you can only view the Moving Average for the specific time frame you are viewing, meaning constantly switching (i.e. between the 1 hour and 1 day chart) to look for relevant areas of support/resistance that need to be taken into account. With this indicator, as long as you remain in the 1 hour view, it displays the 50, 100 & 200 MA for multiple time frames all at the same time, revealing crucial support/resistance you might otherwise miss.
When in use, open the settings for the indicator if you need to check the colour of each moving average or wish to change the colour scheme. Add this indicator to your favourites and you might be surprised just how useful it can be.
Please give me a thumbs up if you found this useful. This tool is for educational purposes only and not a recommendation to buy or sell. Always do your own research before trading.
Best wishes,
BCryptological
- Green = 1h 50MA
- Blue = 1h 100MA & 2h 50MA
- Red = 1h 200MA & 2h 100MA & 4h 50MA
- Pink = 2h 200MA & 4h 100MA
- Orange = 4h 200MA
- Light grey = 1D 50MA
- Dark grey = 1D 100MA
- Black = 1D 200MA
What is a Moving Average?
Smooths out the price across each period to reveal short, medium and long term trends and their relationship to each other. Moving averages can often be expected to act as lines of support and resistance, better allowing you to predict where a price move might stop or falter. The higher the moving average time frame the more significant the support/resistance will be.
Why is this indicator different from other Moving Average scripts?
Usually you can only view the Moving Average for the specific time frame you are viewing, meaning constantly switching (i.e. between the 1 hour and 1 day chart) to look for relevant areas of support/resistance that need to be taken into account. With this indicator, as long as you remain in the 1 hour view, it displays the 50, 100 & 200 MA for multiple time frames all at the same time, revealing crucial support/resistance you might otherwise miss.
When in use, open the settings for the indicator if you need to check the colour of each moving average or wish to change the colour scheme. Add this indicator to your favourites and you might be surprised just how useful it can be.
Please give me a thumbs up if you found this useful. This tool is for educational purposes only and not a recommendation to buy or sell. Always do your own research before trading.
Best wishes,
BCryptological
보호된 스크립트입니다
이 스크립트는 비공개 소스로 게시됩니다. 하지만 이를 자유롭게 제한 없이 사용할 수 있습니다 – 자세한 내용은 여기에서 확인하세요.
면책사항
해당 정보와 게시물은 금융, 투자, 트레이딩 또는 기타 유형의 조언이나 권장 사항으로 간주되지 않으며, 트레이딩뷰에서 제공하거나 보증하는 것이 아닙니다. 자세한 내용은 이용 약관을 참조하세요.
보호된 스크립트입니다
이 스크립트는 비공개 소스로 게시됩니다. 하지만 이를 자유롭게 제한 없이 사용할 수 있습니다 – 자세한 내용은 여기에서 확인하세요.
면책사항
해당 정보와 게시물은 금융, 투자, 트레이딩 또는 기타 유형의 조언이나 권장 사항으로 간주되지 않으며, 트레이딩뷰에서 제공하거나 보증하는 것이 아닙니다. 자세한 내용은 이용 약관을 참조하세요.