OPEN-SOURCE SCRIPT
업데이트됨 Bollinger + RSI Signals (by Bader Kamal)
This idea originally by ChartArt on January 14, 2015 as Strategy, and I modify it to become as Signals on 26 July 2019.
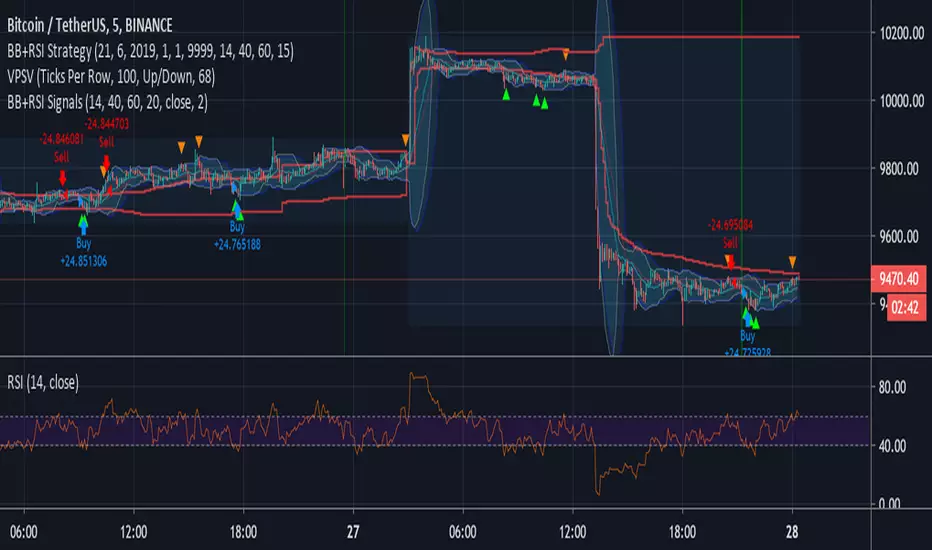
This signals uses a modified RSI to sell when the RSI increases over the value of 60 (or to buy when the value falls below 40), with the classic Bollinger Bands strategy to sell when the price is above the upper Bollinger Band (and to buy when this value is below the lower band).
This signals only triggers when both the RSI and the Bollinger Bands indicators are at the same time in a overbought or oversold condition.
릴리즈 노트
I added Alert conditions오픈 소스 스크립트
트레이딩뷰의 진정한 정신에 따라, 이 스크립트의 작성자는 이를 오픈소스로 공개하여 트레이더들이 기능을 검토하고 검증할 수 있도록 했습니다. 작성자에게 찬사를 보냅니다! 이 코드는 무료로 사용할 수 있지만, 코드를 재게시하는 경우 하우스 룰이 적용된다는 점을 기억하세요.
면책사항
해당 정보와 게시물은 금융, 투자, 트레이딩 또는 기타 유형의 조언이나 권장 사항으로 간주되지 않으며, 트레이딩뷰에서 제공하거나 보증하는 것이 아닙니다. 자세한 내용은 이용 약관을 참조하세요.
오픈 소스 스크립트
트레이딩뷰의 진정한 정신에 따라, 이 스크립트의 작성자는 이를 오픈소스로 공개하여 트레이더들이 기능을 검토하고 검증할 수 있도록 했습니다. 작성자에게 찬사를 보냅니다! 이 코드는 무료로 사용할 수 있지만, 코드를 재게시하는 경우 하우스 룰이 적용된다는 점을 기억하세요.
면책사항
해당 정보와 게시물은 금융, 투자, 트레이딩 또는 기타 유형의 조언이나 권장 사항으로 간주되지 않으며, 트레이딩뷰에서 제공하거나 보증하는 것이 아닙니다. 자세한 내용은 이용 약관을 참조하세요.