INVITE-ONLY SCRIPT
MACD CFF Edition
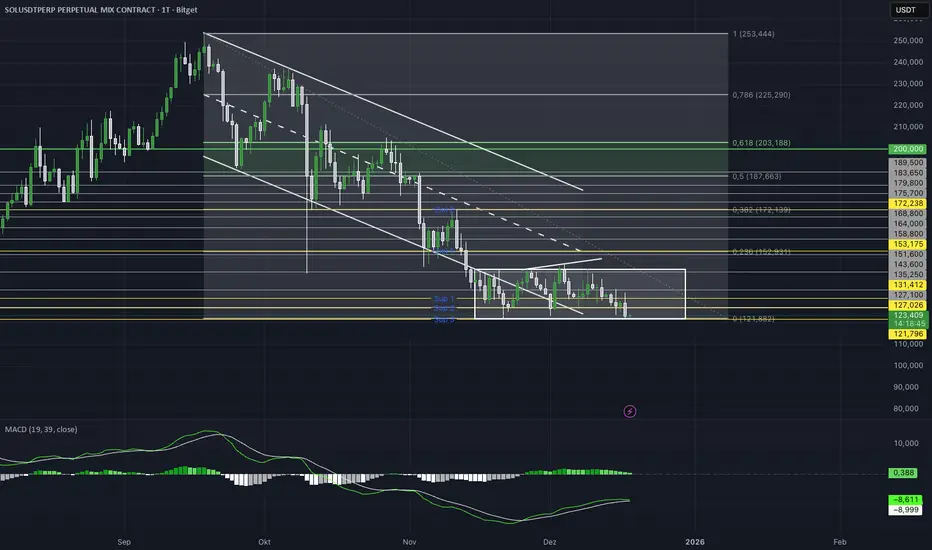
MACD (19 / 39) – Higher Timeframe Momentum
This indicator is a modified MACD version designed specifically for higher timeframes and structural market moves.
Compared to the standard MACD (12 / 26), the periods are intentionally extended to reduce short-term noise and focus on meaningful momentum and trend shifts.
The classic MACD (12 / 26) reacts very quickly and often produces many signals on lower and mid timeframes that mainly reflect micro-volatility.
Using 19 / 39 deliberately slows the indicator down and filters out movements that lack relevance for higher-timeframe market structure.
Line Explanation
White Line – MACD Line (19–39)
This line measures the distance between short-term and mid-term momentum.
It highlights structural changes in capital flow.
Above zero → bullish structural momentum
Below zero → bearish structural momentum
Green Line – Signal Line
A smoothed version of the MACD line.
Used for confirmation, not for fast entry signals.
Crossovers should be interpreted as context confirmation, not buy or sell commands.
Histogram
Displays the distance between the MACD line and the signal line.
Helps identify whether momentum is:
expanding
or weakening
Intended Use
• Best suited for 4H, Daily and Weekly
• Trend and directional bias filter
• Structural confirmation
• Works best combined with price action and key levels
Not a scalping tool. Not a standalone signal indicator.
초대 전용 스크립트
이 스크립트는 작성자가 승인한 사용자만 접근할 수 있습니다. 사용하려면 요청 후 승인을 받아야 하며, 일반적으로 결제 후에 허가가 부여됩니다. 자세한 내용은 아래 작성자의 안내를 따르거나 michlRico에게 직접 문의하세요.
트레이딩뷰는 스크립트의 작동 방식을 충분히 이해하고 작성자를 완전히 신뢰하지 않는 이상, 해당 스크립트에 비용을 지불하거나 사용하는 것을 권장하지 않습니다. 커뮤니티 스크립트에서 무료 오픈소스 대안을 찾아보실 수도 있습니다.
작성자 지시 사항
Schreiben sie mir auf Coinflowfinance !
면책사항
해당 정보와 게시물은 금융, 투자, 트레이딩 또는 기타 유형의 조언이나 권장 사항으로 간주되지 않으며, 트레이딩뷰에서 제공하거나 보증하는 것이 아닙니다. 자세한 내용은 이용 약관을 참조하세요.