OPEN-SOURCE SCRIPT
SuperScript Filtered (Stable)
🔎 What This Indicator Does
The indicator is a trend and momentum filter.
It looks at multiple well-known technical tools (T3 moving averages, RSI, TSI, and EMA trend) and assigns a score to the current market condition.
• If most tools are bullish → score goes up.
• If most tools are bearish → score goes down.
• Only when the score is very strong (above +75 or below -75), it prints a Buy or Sell signal.
This helps traders focus only on high-probability setups instead of reacting to every small wiggle in price.
________________________________________
⚙️ How It Works
1. T3 Trend Check
o Compares a fast and slow T3 moving average.
o If the fast T3 is above the slow T3 → bullish signal.
o If it’s below → bearish signal.
2. RSI Check
o Uses the Relative Strength Index.
o If RSI is above 50 → bullish momentum.
o If RSI is below 50 → bearish momentum.
3. TSI Check
o Uses the True Strength Index.
o If TSI is above its signal line → bullish momentum.
o If TSI is below → bearish momentum.
4. EMA Trend Check
o Looks at two exponential moving averages (fast and slow).
o If price is above both → bullish.
o If price is below both → bearish.
5. Score System
o Each condition contributes +25 (bullish) or -25 (bearish).
o The total score can range from -100 to +100.
o Score ≥ +75 → Strong Buy
o Score ≤ -75 → Strong Sell
6. Signal Filtering
o Only one buy is allowed until a sell appears (and vice versa).
o A minimum bar gap is enforced between signals to avoid clutter.
________________________________________
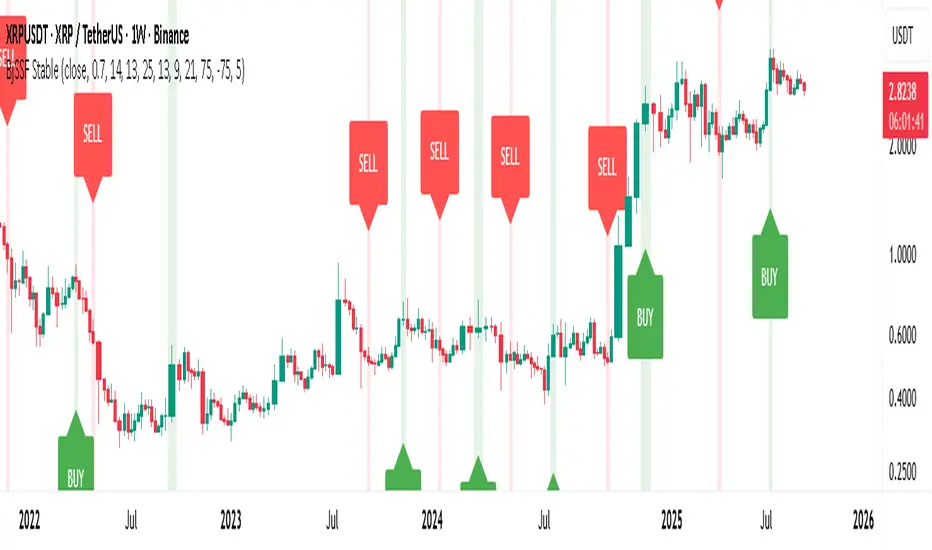
📊 How It Appears on the Chart
• Green “BUY” label below candles → when multiple signals agree and the market is strongly bullish.
• Red “SELL” label above candles → when multiple signals agree and the market is strongly bearish.
• Background softly shaded green or red → highlights bullish or bearish conditions.
No messy tables, no clutter — just clear trend-based entries.
________________________________________
🎯 How Traders Can Use It
This indicator is designed to help traders by:
1. Filtering Noise
o Instead of reacting to every small crossover or RSI blip, it waits until at least 3–4 conditions agree.
o This avoids entering weak trades.
2. Identifying Strong Trend Shifts
o When a Buy or Sell arrow appears, it usually signals a shift in momentum that can lead to a larger move.
3. Reducing Overtrading
o By limiting signals, traders won’t be tempted to jump in and out unnecessarily.
4. Trade Confirmation
o Traders can use the signals as confirmation for their own setups.
o Example: If your strategy says “go long” and the indicator also shows a strong Buy, that trade has more conviction.
5. Alert Automation
o Built-in alerts mean you don’t have to watch the chart all day.
o You’ll be notified only when a strong signal appears.
________________________________________
⚡ When It Helps the Most
• Works best in trending markets (bullish or bearish).
• Very useful on higher timeframes (1h, 4h, daily) for swing trading.
• Can also work on lower timeframes (5m, 15m) if combined with higher timeframe trend filtering.
________________________________________
👉 In short
This indicator is a signal filter + trend detector. It combines four powerful tools into one scoring system, and only tells you to act when the odds are stacked in your favor.
________________________________________
The indicator is a trend and momentum filter.
It looks at multiple well-known technical tools (T3 moving averages, RSI, TSI, and EMA trend) and assigns a score to the current market condition.
• If most tools are bullish → score goes up.
• If most tools are bearish → score goes down.
• Only when the score is very strong (above +75 or below -75), it prints a Buy or Sell signal.
This helps traders focus only on high-probability setups instead of reacting to every small wiggle in price.
________________________________________
⚙️ How It Works
1. T3 Trend Check
o Compares a fast and slow T3 moving average.
o If the fast T3 is above the slow T3 → bullish signal.
o If it’s below → bearish signal.
2. RSI Check
o Uses the Relative Strength Index.
o If RSI is above 50 → bullish momentum.
o If RSI is below 50 → bearish momentum.
3. TSI Check
o Uses the True Strength Index.
o If TSI is above its signal line → bullish momentum.
o If TSI is below → bearish momentum.
4. EMA Trend Check
o Looks at two exponential moving averages (fast and slow).
o If price is above both → bullish.
o If price is below both → bearish.
5. Score System
o Each condition contributes +25 (bullish) or -25 (bearish).
o The total score can range from -100 to +100.
o Score ≥ +75 → Strong Buy
o Score ≤ -75 → Strong Sell
6. Signal Filtering
o Only one buy is allowed until a sell appears (and vice versa).
o A minimum bar gap is enforced between signals to avoid clutter.
________________________________________
📊 How It Appears on the Chart
• Green “BUY” label below candles → when multiple signals agree and the market is strongly bullish.
• Red “SELL” label above candles → when multiple signals agree and the market is strongly bearish.
• Background softly shaded green or red → highlights bullish or bearish conditions.
No messy tables, no clutter — just clear trend-based entries.
________________________________________
🎯 How Traders Can Use It
This indicator is designed to help traders by:
1. Filtering Noise
o Instead of reacting to every small crossover or RSI blip, it waits until at least 3–4 conditions agree.
o This avoids entering weak trades.
2. Identifying Strong Trend Shifts
o When a Buy or Sell arrow appears, it usually signals a shift in momentum that can lead to a larger move.
3. Reducing Overtrading
o By limiting signals, traders won’t be tempted to jump in and out unnecessarily.
4. Trade Confirmation
o Traders can use the signals as confirmation for their own setups.
o Example: If your strategy says “go long” and the indicator also shows a strong Buy, that trade has more conviction.
5. Alert Automation
o Built-in alerts mean you don’t have to watch the chart all day.
o You’ll be notified only when a strong signal appears.
________________________________________
⚡ When It Helps the Most
• Works best in trending markets (bullish or bearish).
• Very useful on higher timeframes (1h, 4h, daily) for swing trading.
• Can also work on lower timeframes (5m, 15m) if combined with higher timeframe trend filtering.
________________________________________
👉 In short
This indicator is a signal filter + trend detector. It combines four powerful tools into one scoring system, and only tells you to act when the odds are stacked in your favor.
________________________________________
오픈 소스 스크립트
트레이딩뷰의 진정한 정신에 따라, 이 스크립트의 작성자는 이를 오픈소스로 공개하여 트레이더들이 기능을 검토하고 검증할 수 있도록 했습니다. 작성자에게 찬사를 보냅니다! 이 코드는 무료로 사용할 수 있지만, 코드를 재게시하는 경우 하우스 룰이 적용된다는 점을 기억하세요.
Trade forex, indices, stocks and metals with up to US$100.000 in company's funding.
Complete a challenge to access funding or go for instant deposit.
Trading involves substantial risk. Not financial advice
Complete a challenge to access funding or go for instant deposit.
Trading involves substantial risk. Not financial advice
면책사항
해당 정보와 게시물은 금융, 투자, 트레이딩 또는 기타 유형의 조언이나 권장 사항으로 간주되지 않으며, 트레이딩뷰에서 제공하거나 보증하는 것이 아닙니다. 자세한 내용은 이용 약관을 참조하세요.