INVITE-ONLY SCRIPT
업데이트됨 [VIP] ABCD Pattern
DESCRIPTION
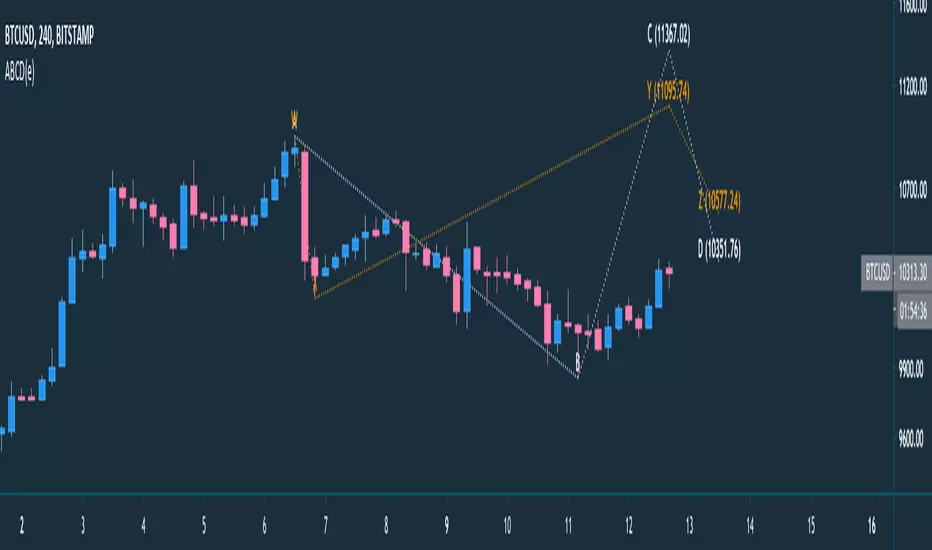
The AB=CD pattern is one of the most popular harmonic chart patterns.
Buy and sell signals are generated after the final C-to-D leg, when a reversal is expected to occur.
If the pattern is trending higher, you can look to sell or enter a short position at Point D.
If the pattern is trending lower, you can look to buy the security at Point D in anticipation of a turnaround.
Stop-loss points are best placed just above or below Point D, depending on the direction of the trade.
If the move extends beyond that point, the chart pattern is invalidated and the reversal is less likely to occur.
Take-profit points are typically placed using Fibonacci levels.
For example, you might look for a move back to the original Point A and move a trailing stop-loss to 28.2%, 50% and 61.8% Fibonacci levels along the way.
The AB=CD chart pattern works best when combined with other technical indicators or chart patterns, such as the relative strength index (RSI) or pivot points.
You may also want to use volume as a confirmation of a reversal once the AB=CD chart pattern makes a prediction.
CONFIGURATION
Please check link below for but report, trial and join with community
The AB=CD pattern is one of the most popular harmonic chart patterns.
Buy and sell signals are generated after the final C-to-D leg, when a reversal is expected to occur.
If the pattern is trending higher, you can look to sell or enter a short position at Point D.
If the pattern is trending lower, you can look to buy the security at Point D in anticipation of a turnaround.
Stop-loss points are best placed just above or below Point D, depending on the direction of the trade.
If the move extends beyond that point, the chart pattern is invalidated and the reversal is less likely to occur.
Take-profit points are typically placed using Fibonacci levels.
For example, you might look for a move back to the original Point A and move a trailing stop-loss to 28.2%, 50% and 61.8% Fibonacci levels along the way.
The AB=CD chart pattern works best when combined with other technical indicators or chart patterns, such as the relative strength index (RSI) or pivot points.
You may also want to use volume as a confirmation of a reversal once the AB=CD chart pattern makes a prediction.
CONFIGURATION
- Strategy ABCD :
- AB=CD : Leg AB is equal to leg CD
- Ratio : Formula to get leg CD by (AB/0.618) x 1.272 but if
- Forecast : is the continuity of ratio abcd, it is called ABCDE - Different between ABCD vs WXYZ, ABCD is harmonic pattern based on latest chart, but WXYZ based on previous preiodic
- Label style : Balloon will show with comment box, but Text just a simple character without comment shape
- Line style : default is dotted, available values are dashed, solid and dotted
- Colour : change line colour for line and text
- Show label : Display or hide label
Please check link below for but report, trial and join with community
릴리즈 노트
Update C and D tags Labels릴리즈 노트
bugfix calculation릴리즈 노트
Added forecast ab=cdFixed line CD issue on forecast
Fixed monthly chart issue
초대 전용 스크립트
이 스크립트는 작성자가 승인한 사용자만 접근할 수 있습니다. 사용하려면 요청 후 승인을 받아야 하며, 일반적으로 결제 후에 허가가 부여됩니다. 자세한 내용은 아래 작성자의 안내를 따르거나 deSultanTM에게 직접 문의하세요.
트레이딩뷰는 스크립트의 작동 방식을 충분히 이해하고 작성자를 완전히 신뢰하지 않는 이상, 해당 스크립트에 비용을 지불하거나 사용하는 것을 권장하지 않습니다. 커뮤니티 스크립트에서 무료 오픈소스 대안을 찾아보실 수도 있습니다.
작성자 지시 사항
면책사항
해당 정보와 게시물은 금융, 투자, 트레이딩 또는 기타 유형의 조언이나 권장 사항으로 간주되지 않으며, 트레이딩뷰에서 제공하거나 보증하는 것이 아닙니다. 자세한 내용은 이용 약관을 참조하세요.