OPEN-SOURCE SCRIPT
Taiwan Pagoda Chart (Triple)
The code is open-source.
======================
Indicator Name
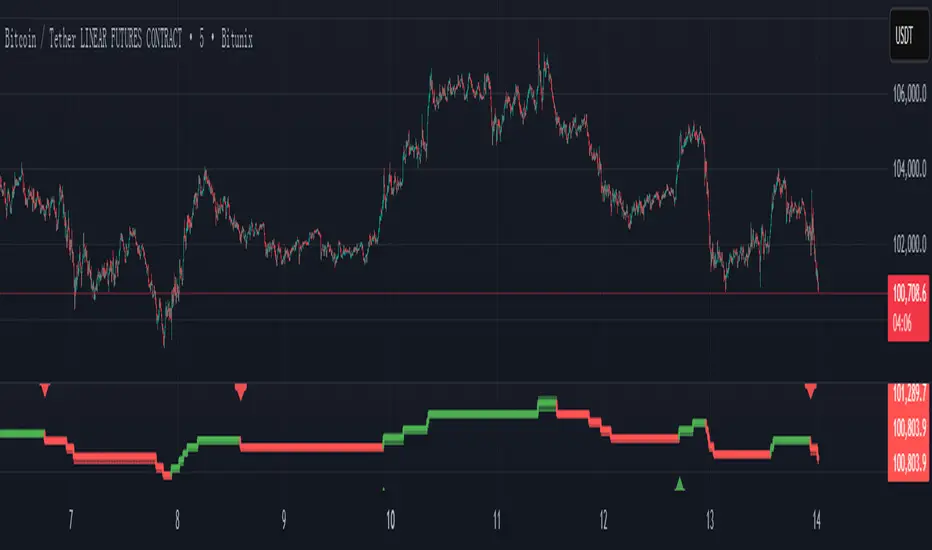
Taiwan Pagoda Chart
This is a technical analysis charting method similar to candlesticks but with different logic, designed to filter market noise and identify trend reversal points.
Key Features
Dynamic Pagoda Line Plotting
Unlike traditional candlesticks that plot every bar, the Pagoda line only updates when the price breaks above the previous high or below the previous low by a certain threshold.
Bullish (rising) bars are shown in green; bearish (falling) bars in red.
Multiple Optional Filters
T-value filter: Sets a minimum price change threshold to avoid signals from minor fluctuations.
Price percentage filter: Dynamically adjusts sensitivity based on a percentage of the previous Pagoda bar’s range.
ATR volatility filter: Uses Average True Range (ATR) to widen the threshold during high volatility and tighten it during low volatility.
Visual Design
Semi-transparent Pagoda structure for better visual context.
A bold central trend line to clearly show the underlying market direction.
Trading Signal Alerts
Bullish reversal (turning green): Potential buy signal.
Bearish reversal (turning red): Potential sell signal.
Optional on-chart labels (B / S) and support for TradingView alert notifications.
Highly Customizable
Users can freely adjust colors, line width, filtering rules, and signal visibility—making it adaptable to various trading styles.
Ideal Use Cases
Trend following
Reducing false breakouts
Helping medium-to-long-term traders identify high-probability entry and exit points
======================
Indicator Name
Taiwan Pagoda Chart
This is a technical analysis charting method similar to candlesticks but with different logic, designed to filter market noise and identify trend reversal points.
Key Features
Dynamic Pagoda Line Plotting
Unlike traditional candlesticks that plot every bar, the Pagoda line only updates when the price breaks above the previous high or below the previous low by a certain threshold.
Bullish (rising) bars are shown in green; bearish (falling) bars in red.
Multiple Optional Filters
T-value filter: Sets a minimum price change threshold to avoid signals from minor fluctuations.
Price percentage filter: Dynamically adjusts sensitivity based on a percentage of the previous Pagoda bar’s range.
ATR volatility filter: Uses Average True Range (ATR) to widen the threshold during high volatility and tighten it during low volatility.
Visual Design
Semi-transparent Pagoda structure for better visual context.
A bold central trend line to clearly show the underlying market direction.
Trading Signal Alerts
Bullish reversal (turning green): Potential buy signal.
Bearish reversal (turning red): Potential sell signal.
Optional on-chart labels (B / S) and support for TradingView alert notifications.
Highly Customizable
Users can freely adjust colors, line width, filtering rules, and signal visibility—making it adaptable to various trading styles.
Ideal Use Cases
Trend following
Reducing false breakouts
Helping medium-to-long-term traders identify high-probability entry and exit points
오픈 소스 스크립트
트레이딩뷰의 진정한 정신에 따라, 이 스크립트의 작성자는 이를 오픈소스로 공개하여 트레이더들이 기능을 검토하고 검증할 수 있도록 했습니다. 작성자에게 찬사를 보냅니다! 이 코드는 무료로 사용할 수 있지만, 코드를 재게시하는 경우 하우스 룰이 적용된다는 점을 기억하세요.
면책사항
해당 정보와 게시물은 금융, 투자, 트레이딩 또는 기타 유형의 조언이나 권장 사항으로 간주되지 않으며, 트레이딩뷰에서 제공하거나 보증하는 것이 아닙니다. 자세한 내용은 이용 약관을 참조하세요.
오픈 소스 스크립트
트레이딩뷰의 진정한 정신에 따라, 이 스크립트의 작성자는 이를 오픈소스로 공개하여 트레이더들이 기능을 검토하고 검증할 수 있도록 했습니다. 작성자에게 찬사를 보냅니다! 이 코드는 무료로 사용할 수 있지만, 코드를 재게시하는 경우 하우스 룰이 적용된다는 점을 기억하세요.
면책사항
해당 정보와 게시물은 금융, 투자, 트레이딩 또는 기타 유형의 조언이나 권장 사항으로 간주되지 않으며, 트레이딩뷰에서 제공하거나 보증하는 것이 아닙니다. 자세한 내용은 이용 약관을 참조하세요.