OPEN-SOURCE SCRIPT
DMI + ADX + Key Level NACHOMIXCRYPTO
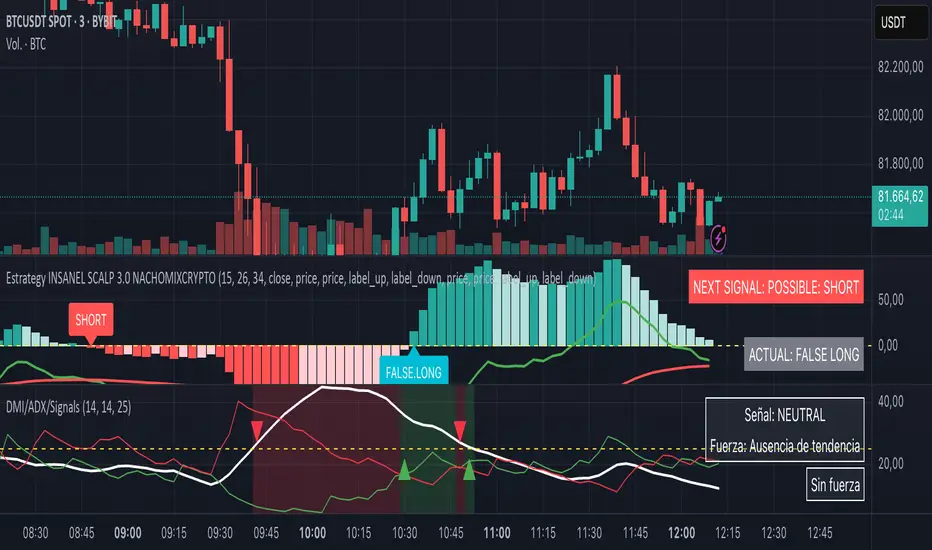
The DMI + ADX + Key Level NACHOMIXCRYPTO indicator is a technical analysis tool that combines the Directional Movement Index (DMI) and the Average Directional Index (ADX) to assess trend strength and direction. It also includes customizable key levels for better visualization.
Components:
ADX (Average Directional Index):
Measures the strength of a trend, regardless of its direction.
Values below 25 indicate a weak trend or range-bound market.
Values between 25-50 suggest a strong trend.
Values between 50-75 indicate a very strong trend.
Values above 75 represent an extremely strong trend.
+DI (Positive Directional Indicator) and -DI (Negative Directional Indicator):
+DI indicates bullish strength, shown in green.
-DI indicates bearish strength, shown in red.
The comparison between these two lines helps determine the market direction.
Features:
Trend Detection:
When +DI is above -DI and ADX is above the key level, it signals a bullish trend.
When -DI is above +DI and ADX is above the key level, it signals a bearish trend.
Key Level Line:
A customizable horizontal line that marks the threshold for trend strength.
Trend Background Color:
Green for strong uptrends and red for strong downtrends.
Signal Arrows:
A green upward triangle is plotted when a new bullish trend starts.
A red downward triangle is plotted when a new bearish trend starts.
Trend Strength Labels:
The indicator displays the current market strength classification and whether the trend is bullish, bearish, or neutral.
Strength Analysis Table:
Provides insights on whether the market has bullish, bearish, mixed strength, or no strength at all.
This indicator is particularly useful for traders looking to identify strong trends and catch early trend reversals.
오픈 소스 스크립트
트레이딩뷰의 진정한 정신에 따라, 이 스크립트의 작성자는 이를 오픈소스로 공개하여 트레이더들이 기능을 검토하고 검증할 수 있도록 했습니다. 작성자에게 찬사를 보냅니다! 이 코드는 무료로 사용할 수 있지만, 코드를 재게시하는 경우 하우스 룰이 적용된다는 점을 기억하세요.
면책사항
해당 정보와 게시물은 금융, 투자, 트레이딩 또는 기타 유형의 조언이나 권장 사항으로 간주되지 않으며, 트레이딩뷰에서 제공하거나 보증하는 것이 아닙니다. 자세한 내용은 이용 약관을 참조하세요.
오픈 소스 스크립트
트레이딩뷰의 진정한 정신에 따라, 이 스크립트의 작성자는 이를 오픈소스로 공개하여 트레이더들이 기능을 검토하고 검증할 수 있도록 했습니다. 작성자에게 찬사를 보냅니다! 이 코드는 무료로 사용할 수 있지만, 코드를 재게시하는 경우 하우스 룰이 적용된다는 점을 기억하세요.
면책사항
해당 정보와 게시물은 금융, 투자, 트레이딩 또는 기타 유형의 조언이나 권장 사항으로 간주되지 않으며, 트레이딩뷰에서 제공하거나 보증하는 것이 아닙니다. 자세한 내용은 이용 약관을 참조하세요.