OPEN-SOURCE SCRIPT
Regression Slope Shift
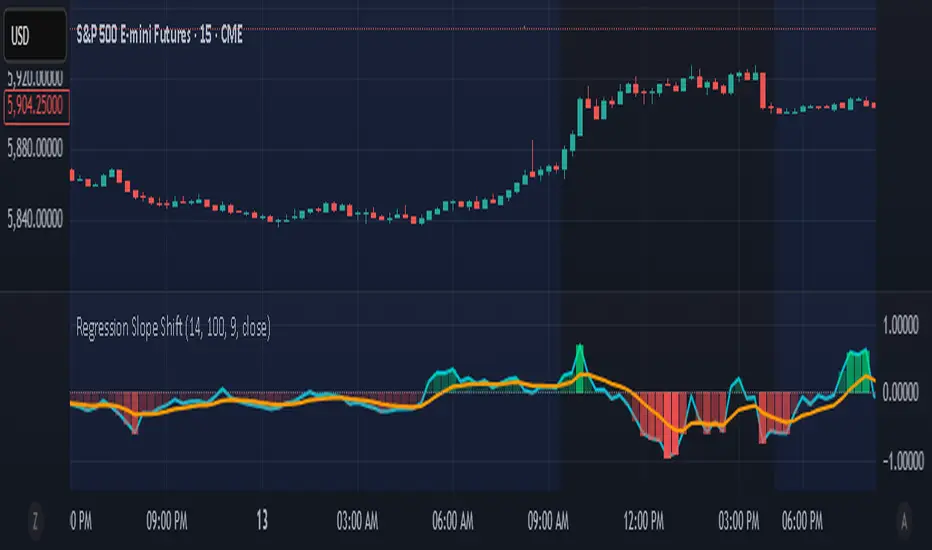
Normalized Regression Slope Shift + Dynamic Histogram
This indicator detects subtle shifts in price momentum using a rolling linear regression approach. It calculates the slope of a linear regression line for each bar over a specified lookback period, then measures how that slope changes from bar to bar.
Both the slope and its change (delta) are normalized to a -1 to 1 scale for consistent visual interpretation across assets and timeframes. A signal line (EMA) is applied to the slope delta to help identify turning points and crossovers.
Key features:
- Normalized slope and slope change lines
- Dynamic histogram of slope delta with transparency based on magnitude
- Customizable colors for all visual elements
- Signal line for crossover-based momentum shifts
This tool helps traders anticipate trend acceleration or weakening before traditional momentum indicators react, making it useful for early trend detection, divergence spotting, and confirmation signals.
오픈 소스 스크립트
트레이딩뷰의 진정한 정신에 따라, 이 스크립트의 작성자는 이를 오픈소스로 공개하여 트레이더들이 기능을 검토하고 검증할 수 있도록 했습니다. 작성자에게 찬사를 보냅니다! 이 코드는 무료로 사용할 수 있지만, 코드를 재게시하는 경우 하우스 룰이 적용된다는 점을 기억하세요.
면책사항
해당 정보와 게시물은 금융, 투자, 트레이딩 또는 기타 유형의 조언이나 권장 사항으로 간주되지 않으며, 트레이딩뷰에서 제공하거나 보증하는 것이 아닙니다. 자세한 내용은 이용 약관을 참조하세요.
오픈 소스 스크립트
트레이딩뷰의 진정한 정신에 따라, 이 스크립트의 작성자는 이를 오픈소스로 공개하여 트레이더들이 기능을 검토하고 검증할 수 있도록 했습니다. 작성자에게 찬사를 보냅니다! 이 코드는 무료로 사용할 수 있지만, 코드를 재게시하는 경우 하우스 룰이 적용된다는 점을 기억하세요.
면책사항
해당 정보와 게시물은 금융, 투자, 트레이딩 또는 기타 유형의 조언이나 권장 사항으로 간주되지 않으며, 트레이딩뷰에서 제공하거나 보증하는 것이 아닙니다. 자세한 내용은 이용 약관을 참조하세요.