OPEN-SOURCE SCRIPT
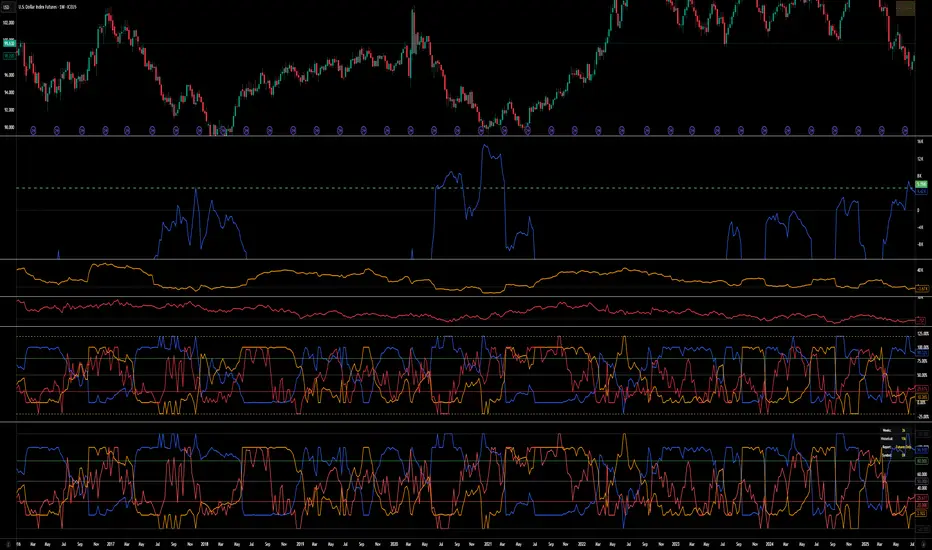
COT Index v.2

COT Index v.2 Indicator
( fix for extreme values)
📊 Overview
The COT (Commitment of Traders) Index Indicator transforms raw COT data into normalized indices ranging from 0-100, with extensions to 120 and -20 for extreme market conditions. This powerful tool helps traders analyze institutional positioning and market sentiment by tracking the net long positions of three key market participant groups.
🎯 What It Does
This indicator converts weekly CFTC Commitment of Traders data into easy-to-read oscillator format, showing:
Commercial Index (Blue Line) - Smart money/hedgers positioning
NonCommercial Index (Orange Line) - Large speculators/funds positioning
Nonreportable Index (Red Line) - Small traders positioning
📈 Key Features
Smart Scaling Algorithm
0-100 Range: Normal market conditions based on recent price action
120 Level: Extreme bullish positioning (above historical maximum)
-20 Level: Extreme bearish positioning (below historical minimum)
Dual Time Frame Analysis
Short Period (26 weeks default): For current market scaling
Historical Period (156 weeks default): For extreme condition detection
Flexible Data Sources
Futures Only reports
Futures and Options combined reports
Automatic symbol detection with manual overrides for HG and LBR
🔧 Customizable Settings
Data Configuration
Adjustable lookback periods for both current and historical analysis
Report type selection (Futures vs Futures & Options)
Display Options
Toggle individual trader categories on/off
Customizable reference lines (overbought/oversold levels)
Optional 0/100 boundary lines
Adjustable line widths and colors
Reference Levels
Upper Bound: 120 (extreme bullish)
Overbought: 80 (default)
Midline: 50 (neutral)
Oversold: 20 (default)
Lower Bound: -20 (extreme bearish)
💡 Trading Applications
Contrarian Signals
High Commercial Index + Low NonCommercial Index = Potential bullish reversal
Low Commercial Index + High NonCommercial Index = Potential bearish reversal
Market Sentiment Analysis
Track institutional vs retail positioning divergences
Identify extreme market conditions requiring attention
Monitor smart money accumulation/distribution patterns
Confirmation Tool
Use alongside technical analysis for trade confirmation
Validate breakouts with positioning data
Assess market structure changes
📊 Visual Elements
Status Table: Displays current settings and symbol information
Color-Coded Lines: Easy identification of each trader category
Reference Levels: Clear overbought/oversold boundaries
Extreme Indicators: Visual cues for unusual market conditions
⚠️ Important Notes
COT data is released weekly on Fridays (Tuesday data)
Best suited for weekly and daily timeframes
Requires symbols with available CFTC data
Works automatically for most futures contracts
🎯 Best Practices
Use in conjunction with price action analysis
Look for divergences between price and positioning
Pay special attention to extreme readings (120/-20 levels)
Consider all three indices together for complete market picture
Allow for data lag (3-day delay from CFTC)
This indicator is ideal for swing traders, position traders, and anyone interested in understanding the positioning dynamics of professional vs retail market participants.
오픈 소스 스크립트
트레이딩뷰의 진정한 정신에 따라, 이 스크립트의 작성자는 이를 오픈소스로 공개하여 트레이더들이 기능을 검토하고 검증할 수 있도록 했습니다. 작성자에게 찬사를 보냅니다! 이 코드는 무료로 사용할 수 있지만, 코드를 재게시하는 경우 하우스 룰이 적용된다는 점을 기억하세요.
면책사항
해당 정보와 게시물은 금융, 투자, 트레이딩 또는 기타 유형의 조언이나 권장 사항으로 간주되지 않으며, 트레이딩뷰에서 제공하거나 보증하는 것이 아닙니다. 자세한 내용은 이용 약관을 참조하세요.
오픈 소스 스크립트
트레이딩뷰의 진정한 정신에 따라, 이 스크립트의 작성자는 이를 오픈소스로 공개하여 트레이더들이 기능을 검토하고 검증할 수 있도록 했습니다. 작성자에게 찬사를 보냅니다! 이 코드는 무료로 사용할 수 있지만, 코드를 재게시하는 경우 하우스 룰이 적용된다는 점을 기억하세요.
면책사항
해당 정보와 게시물은 금융, 투자, 트레이딩 또는 기타 유형의 조언이나 권장 사항으로 간주되지 않으며, 트레이딩뷰에서 제공하거나 보증하는 것이 아닙니다. 자세한 내용은 이용 약관을 참조하세요.