OPEN-SOURCE SCRIPT
업데이트됨 New Highs - Marker
Description:
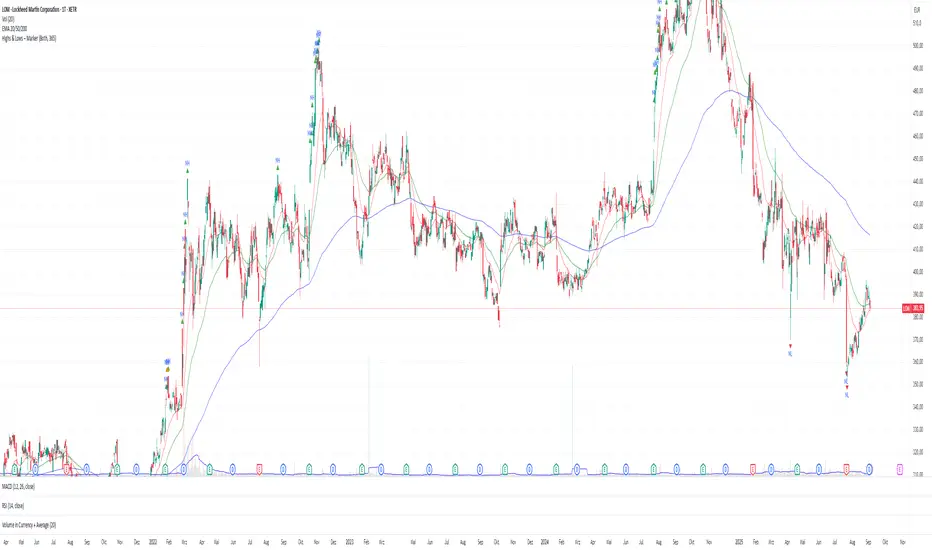
Use this tool to quickly spot breakouts or double-top style patterns as they form.
- This indicator highlights every bar that sets a new high or matches the previous high.
- New Highs (ATH or Lookback Highs) are marked with a green triangle above the candle.
- Equal Highs (ties) are marked with an orange triangle above the candle.
- You can choose between All-Time Highs (lookback = 0) or rolling lookback highs over a user-defined number of bars.
- Alerts are included for both new highs and equal highs.
Use this tool to quickly spot breakouts or double-top style patterns as they form.
릴리즈 노트
--this updated version now also shows new lows--New Highs & New Lows – Marker
This indicator automatically highlights new highs and lows on your chart. It works in two modes:
Lookback Mode (Lookback > 0): Marks new highs or lows relative to the last N bars.
Both new extremes and equal highs/lows (ties) can be visualized with different colors and shapes. Alerts are included so you can be notified as soon as new highs or lows appear.
Use this tool to quickly spot breakouts, double tops/bottoms, or potential support/resistance levels.
Features
✅ Detect new highs and new lows
✅ Highlight equal highs and lows (ties)
✅ All-Time or rolling lookback mode
✅ Option to show only highs, only lows, or both
✅ Customizable colors and markers
✅ Built-in alerts for all conditions
Inputs & Settings
Mode: Choose between
B
- oth → Show both highs and lows
- Only Highs → Show only highs
- On
Lookback:
- 0 → All-Time Highs/Lows (since the beginning of the chart)
- >0 → Rolling highs/lows based on the last N bars
- Show New Highs/Lows: Toggle visibility of fresh highs/lows
- S
Colors:
- Green → New Highs
- Orange → Equal Highs
- Red → New Lows
- Ora
Alerts
The indicator includes 4 alert conditions:
- New High – when a bar creates a higher high
- Equal High – when a bar touches the same high
- New Low – when a bar creates a lower low
- Equal Low – when a bar touches the same low
- To enab
How to Use
Add the indicator to your chart.
Choose Lookback = 0 to track all-time highs/lows, or set a number (e.g., 20) for a rolling window.
Select Mode → Highs only, Lows only, or Both.
Customize colors and alerts to fit your strategy.
Watch for markers above/below bars:
Triangles Up (above candles) → Highs
Triangles Down (below candles) → Lows
오픈 소스 스크립트
트레이딩뷰의 진정한 정신에 따라, 이 스크립트의 작성자는 이를 오픈소스로 공개하여 트레이더들이 기능을 검토하고 검증할 수 있도록 했습니다. 작성자에게 찬사를 보냅니다! 이 코드는 무료로 사용할 수 있지만, 코드를 재게시하는 경우 하우스 룰이 적용된다는 점을 기억하세요.
면책사항
해당 정보와 게시물은 금융, 투자, 트레이딩 또는 기타 유형의 조언이나 권장 사항으로 간주되지 않으며, 트레이딩뷰에서 제공하거나 보증하는 것이 아닙니다. 자세한 내용은 이용 약관을 참조하세요.
오픈 소스 스크립트
트레이딩뷰의 진정한 정신에 따라, 이 스크립트의 작성자는 이를 오픈소스로 공개하여 트레이더들이 기능을 검토하고 검증할 수 있도록 했습니다. 작성자에게 찬사를 보냅니다! 이 코드는 무료로 사용할 수 있지만, 코드를 재게시하는 경우 하우스 룰이 적용된다는 점을 기억하세요.
면책사항
해당 정보와 게시물은 금융, 투자, 트레이딩 또는 기타 유형의 조언이나 권장 사항으로 간주되지 않으며, 트레이딩뷰에서 제공하거나 보증하는 것이 아닙니다. 자세한 내용은 이용 약관을 참조하세요.