OPEN-SOURCE SCRIPT
업데이트됨 Time based retracement by DOW - stats
Time-Based Retracement by Day of Week (DOW) - Stats
First off a big thanks to tradeforopp and his excellent video tutorial that provided the core logic for calculating stats and inspired and helped this project immensely!
Overview
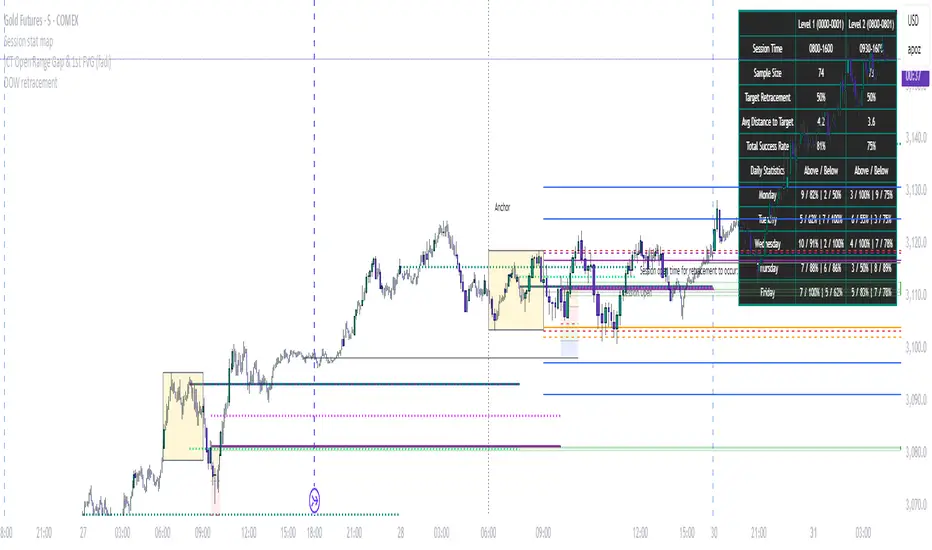
This Trading View indicator tracks the retracement behaviour of price movements relative to user-defined opening times and retracement windows. It allows traders to analyse how frequently price returns to a specified retracement level during the trading day, segmented by the day of the week.
Key Features
Customizable Retracement Tracking: Define two independent levels, each with its own opening time, retracement window, and retracement percentage.
Visualization: Plot retracement targets, opening price levels, and retracement levels with customizable colours and line styles.
Day-of-Week Analysis: Tracks how often price retraces to the defined level and aggregates this data per day of the week.
Statistical Table: Displays the total number of sessions, retracement occurrences, and day-wise retracement statistics.
Configuration
The indicator provides extensive customization options to tailor retracement analysis:
Level 1 & Level 2 Settings
Open Time: Set the session opening time for retracement tracking.
Retracement Window: Define the time range during which retracement must occur.
Retracement Percentage: Specify the percentage retracement to be tracked from the open price.
Display Options: Toggle visibility of retracement lines, labels, and opening price markers.
Colour and Style: Customize the colours and styles of plotted lines and labels.
Statistical Table Settings
Enable/Disable Table: Choose whether to display retracement statistics.
Position & Style: Set table position, text size, background colour, and border styles.
How It Works
At the user-defined open time, the indicator captures the opening price.
It calculates the retracement level based on the selected retracement percentage.
During the specified retracement window, the indicator checks if the price touches the calculated retracement level.
If the retracement occurs, a count is recorded for that session and the respective day of the week.
The results are displayed in a table, showing the total number of sessions, the number of successful retracements, and a breakdown by day of the week.
Use Cases
Assess Market Behaviour: Identify which days have a higher probability of retracement.
Backtest Trading Strategies: Validate retracement-based entry or exit strategies.
Visual Confirmation: Easily see retracement levels and their historical occurrences on the chart.
Notes
The indicator does not provide trade signals but serves as an analytical tool.
Ensure your Trading View chart is set to the correct time zone for accurate session tracking.
Adjust settings based on market conditions for optimal insights.
First off a big thanks to tradeforopp and his excellent video tutorial that provided the core logic for calculating stats and inspired and helped this project immensely!
Overview
This Trading View indicator tracks the retracement behaviour of price movements relative to user-defined opening times and retracement windows. It allows traders to analyse how frequently price returns to a specified retracement level during the trading day, segmented by the day of the week.
Key Features
Customizable Retracement Tracking: Define two independent levels, each with its own opening time, retracement window, and retracement percentage.
Visualization: Plot retracement targets, opening price levels, and retracement levels with customizable colours and line styles.
Day-of-Week Analysis: Tracks how often price retraces to the defined level and aggregates this data per day of the week.
Statistical Table: Displays the total number of sessions, retracement occurrences, and day-wise retracement statistics.
Configuration
The indicator provides extensive customization options to tailor retracement analysis:
Level 1 & Level 2 Settings
Open Time: Set the session opening time for retracement tracking.
Retracement Window: Define the time range during which retracement must occur.
Retracement Percentage: Specify the percentage retracement to be tracked from the open price.
Display Options: Toggle visibility of retracement lines, labels, and opening price markers.
Colour and Style: Customize the colours and styles of plotted lines and labels.
Statistical Table Settings
Enable/Disable Table: Choose whether to display retracement statistics.
Position & Style: Set table position, text size, background colour, and border styles.
How It Works
At the user-defined open time, the indicator captures the opening price.
It calculates the retracement level based on the selected retracement percentage.
During the specified retracement window, the indicator checks if the price touches the calculated retracement level.
If the retracement occurs, a count is recorded for that session and the respective day of the week.
The results are displayed in a table, showing the total number of sessions, the number of successful retracements, and a breakdown by day of the week.
Use Cases
Assess Market Behaviour: Identify which days have a higher probability of retracement.
Backtest Trading Strategies: Validate retracement-based entry or exit strategies.
Visual Confirmation: Easily see retracement levels and their historical occurrences on the chart.
Notes
The indicator does not provide trade signals but serves as an analytical tool.
Ensure your Trading View chart is set to the correct time zone for accurate session tracking.
Adjust settings based on market conditions for optimal insights.
릴리즈 노트
This updated version of the "Time based retracement by DOW - stats" indicator enhances the original functionality by improving the daily hit rate calculations. It now provides more granular statistics for retracement success rates, split by whether the target level is above or below the session start price. Key updates include:Refined Daily Hit Rate Calculation:
Previously, daily success percentages were calculated as hits divided by the total number of sessions. Now, they are based on the total occurrences of each specific day of the week (e.g., hits on Mondays / total Mondays), providing a more accurate day-specific success rate.
Above/Below Retracement Tracking:
Added tracking for hits and occurrences where the retracement target is above or below the session open price.
New statistics show separate hit counts and success percentages for "above" and "below" scenarios, calculated as:
Above % = Hits when target is above open / Total days target was above open
Below % = Hits when target is below open / Total days target was below open
This allows users to analyze retracement performance based on directional bias relative to the session start.
Implementation Details:
Added day_occurrences, above_occurrences, and below_occurrences arrays to track total day counts and directional occurrences.
Updated retracement logic to categorize occurrences when the target is set and hits when they occur.
Modified the stats table to display "Hits Above / % Above | Hits Below / % Below" for each day of the week.
Changelog:
Replaced total session count denominator with day-specific occurrence counts for overall daily hit rates.
Introduced separate tracking and display of above/below retracement statistics for enhanced analysis.
오픈 소스 스크립트
트레이딩뷰의 진정한 정신에 따라, 이 스크립트의 작성자는 이를 오픈소스로 공개하여 트레이더들이 기능을 검토하고 검증할 수 있도록 했습니다. 작성자에게 찬사를 보냅니다! 이 코드는 무료로 사용할 수 있지만, 코드를 재게시하는 경우 하우스 룰이 적용된다는 점을 기억하세요.
면책사항
해당 정보와 게시물은 금융, 투자, 트레이딩 또는 기타 유형의 조언이나 권장 사항으로 간주되지 않으며, 트레이딩뷰에서 제공하거나 보증하는 것이 아닙니다. 자세한 내용은 이용 약관을 참조하세요.
오픈 소스 스크립트
트레이딩뷰의 진정한 정신에 따라, 이 스크립트의 작성자는 이를 오픈소스로 공개하여 트레이더들이 기능을 검토하고 검증할 수 있도록 했습니다. 작성자에게 찬사를 보냅니다! 이 코드는 무료로 사용할 수 있지만, 코드를 재게시하는 경우 하우스 룰이 적용된다는 점을 기억하세요.
면책사항
해당 정보와 게시물은 금융, 투자, 트레이딩 또는 기타 유형의 조언이나 권장 사항으로 간주되지 않으며, 트레이딩뷰에서 제공하거나 보증하는 것이 아닙니다. 자세한 내용은 이용 약관을 참조하세요.