PROTECTED SOURCE SCRIPT
Sacred: Cycles
"Cycles offer freedom to those who see them, and fate to those who don't."
Following liquidity cycles is one of the most useful tools of making in financial markets. Over the longer term, it helps you get in at the beginning of plenty and out before the droughts. This script aims to simplify that for the average trader by displaying tree types of information:
Currents
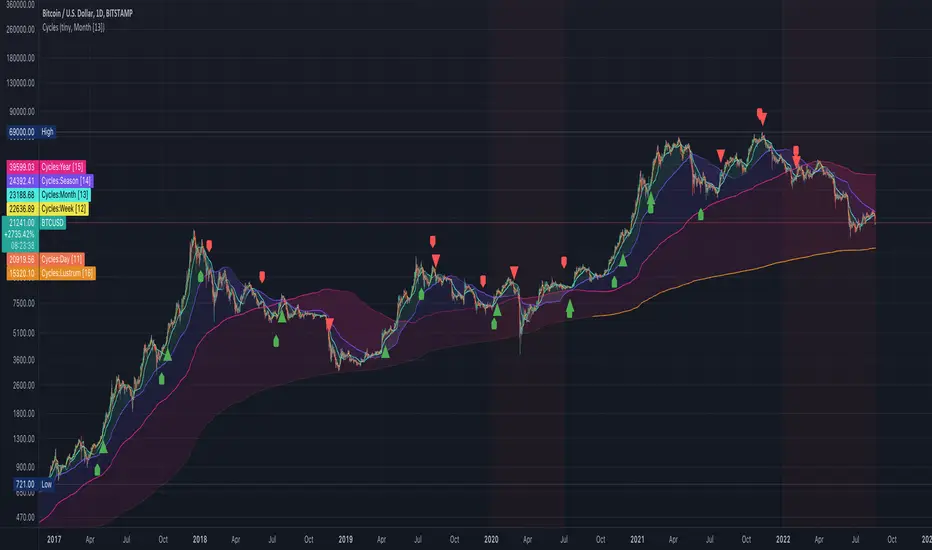
More often than you might imagine, prices are interacting with moving averages across various timeframes. Zoom in or out enough and you'll probably find a moving average that intersects any given price turn/pause. But how to find them? It turns out if you take a fractal approach and scale up or down common time periods, you can generate surprisingly useful support and resistance levels you wouldn't otherwise plot. I call these moving averages "currents". By changing time intervals, you'll be able to find which current is affecting your charts price. (Note: Only works with tickers that have volume data.)

Financial Conditions
Proper technical analysis will give you an idea of which price levels are important and when a pattern is likely to resolve. But how to decide which direction you should bet on? That's where liquidity comes into play. For those tickers that are sensitive to broader liquidity conditions, these markers will tell you if you're in a bearish or bullish regime. After a bearish marker, it's time to sell rips. In a bearish one, buy the dip.

Recessions
Waiting for recessions to be announced by the NBER is a waste of time. You need to know today if recessionary conditions exist. That's where following coincident growth indicators instead of lagging ones helps. This script adds a red background to indicate weakening US growth.

Following liquidity cycles is one of the most useful tools of making in financial markets. Over the longer term, it helps you get in at the beginning of plenty and out before the droughts. This script aims to simplify that for the average trader by displaying tree types of information:
Currents
More often than you might imagine, prices are interacting with moving averages across various timeframes. Zoom in or out enough and you'll probably find a moving average that intersects any given price turn/pause. But how to find them? It turns out if you take a fractal approach and scale up or down common time periods, you can generate surprisingly useful support and resistance levels you wouldn't otherwise plot. I call these moving averages "currents". By changing time intervals, you'll be able to find which current is affecting your charts price. (Note: Only works with tickers that have volume data.)
Financial Conditions
Proper technical analysis will give you an idea of which price levels are important and when a pattern is likely to resolve. But how to decide which direction you should bet on? That's where liquidity comes into play. For those tickers that are sensitive to broader liquidity conditions, these markers will tell you if you're in a bearish or bullish regime. After a bearish marker, it's time to sell rips. In a bearish one, buy the dip.
Recessions
Waiting for recessions to be announced by the NBER is a waste of time. You need to know today if recessionary conditions exist. That's where following coincident growth indicators instead of lagging ones helps. This script adds a red background to indicate weakening US growth.
보호된 스크립트입니다
이 스크립트는 비공개 소스로 게시됩니다. 하지만 이를 자유롭게 제한 없이 사용할 수 있습니다 – 자세한 내용은 여기에서 확인하세요.
"Even the wise cannot see all ends." - Gandalf
Connect with me on Twitter. I'm always open to discuss.
Connect with me on Twitter. I'm always open to discuss.
면책사항
해당 정보와 게시물은 금융, 투자, 트레이딩 또는 기타 유형의 조언이나 권장 사항으로 간주되지 않으며, 트레이딩뷰에서 제공하거나 보증하는 것이 아닙니다. 자세한 내용은 이용 약관을 참조하세요.