OPEN-SOURCE SCRIPT
Bounce Zone
📘 Bounce Zone – Indicator Description
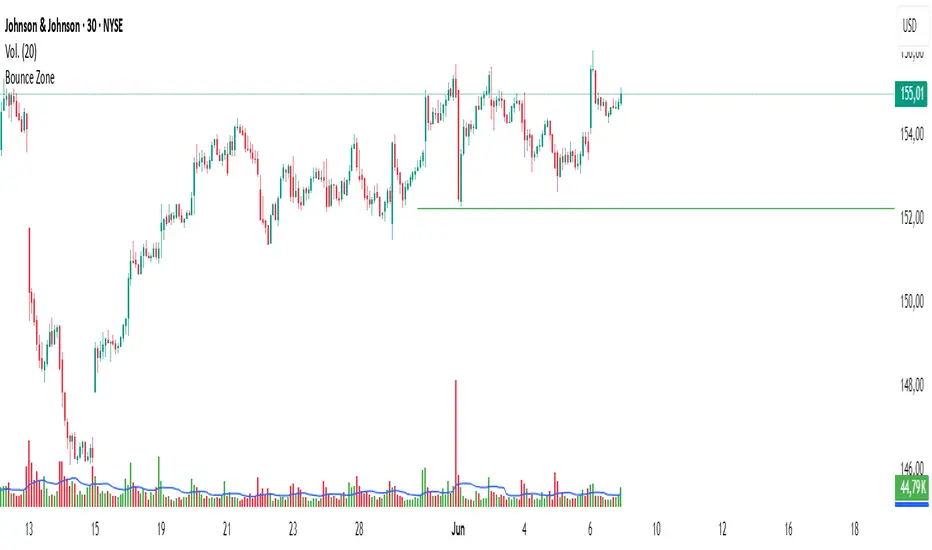
The "Bounce Zone" indicator is a custom tool designed to highlight potential reversal zones on the chart based on volume exhaustion and price structure. It identifies sequences of candles with low volume activity and marks key price levels that could act as "bounce zones", where price is likely to react.
🔍 How It Works
Volume Analysis:
The indicator calculates a Simple Moving Average (SMA) of volume (default: 20 periods).
It looks for at least 6 consecutive candles (configurable) where the volume is below this volume SMA.
Color Consistency:
The candles must all be of the same color:
Green candles (bullish) for potential downward bounce zones.
Red candles (bearish) for potential upward bounce zones.
Zone Detection:
When a valid sequence is found:
For green candles: it draws a horizontal line at the low of the last red candle before the sequence.
For red candles: it draws a horizontal line at the high of the last green candle before the sequence.
Bounce Tracking:
Each horizontal line remains on the chart until it is touched twice by price (high or low depending on direction).
After two touches, the line is automatically removed, indicating the zone has fulfilled its purpose.
📈 Use Cases
Identify areas of price exhaustion after strong directional pushes.
Spot liquidity zones where institutions might step in.
Combine with candlestick confirmation for reversal trades.
Useful in both trending and range-bound markets for entry or exit signals.
⚙️ Parameters
min_consecutive: Minimum number of consecutive low-volume candles of the same color (default: 6).
vol_ma_len: Length of the volume moving average (default: 20).
🧠 Notes
The indicator does not repaint and is based purely on historical candle and volume structure.
Designed for manual strategy confirmation or support for algorithmic setups.
오픈 소스 스크립트
트레이딩뷰의 진정한 정신에 따라, 이 스크립트의 작성자는 이를 오픈소스로 공개하여 트레이더들이 기능을 검토하고 검증할 수 있도록 했습니다. 작성자에게 찬사를 보냅니다! 이 코드는 무료로 사용할 수 있지만, 코드를 재게시하는 경우 하우스 룰이 적용된다는 점을 기억하세요.
면책사항
해당 정보와 게시물은 금융, 투자, 트레이딩 또는 기타 유형의 조언이나 권장 사항으로 간주되지 않으며, 트레이딩뷰에서 제공하거나 보증하는 것이 아닙니다. 자세한 내용은 이용 약관을 참조하세요.
오픈 소스 스크립트
트레이딩뷰의 진정한 정신에 따라, 이 스크립트의 작성자는 이를 오픈소스로 공개하여 트레이더들이 기능을 검토하고 검증할 수 있도록 했습니다. 작성자에게 찬사를 보냅니다! 이 코드는 무료로 사용할 수 있지만, 코드를 재게시하는 경우 하우스 룰이 적용된다는 점을 기억하세요.
면책사항
해당 정보와 게시물은 금융, 투자, 트레이딩 또는 기타 유형의 조언이나 권장 사항으로 간주되지 않으며, 트레이딩뷰에서 제공하거나 보증하는 것이 아닙니다. 자세한 내용은 이용 약관을 참조하세요.