OPEN-SOURCE SCRIPT
업데이트됨 Vol (Wyckoff)
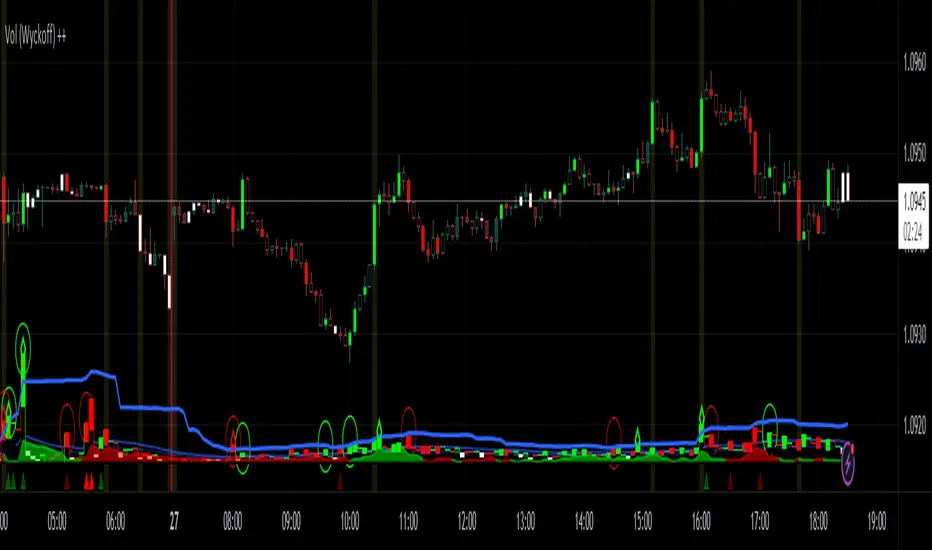
I like TradingView Built-in Volume indicator, because it is overlay with price chart, and has appropriate scale.
I made similar style volume indicator and added concept of Laws of Wyckoff.
caution : You need {Chart settings} → {Appearance} → {Bottom margin} is set 0 %, to make chart look good.
: You need {Chart settings} → {Symbol} → {body} ,{Borders} and {Wick} are set dark color, to easier to identify the color of candles.
This 3 Laws of Wyckoff are my interpretation, not the original.
///////// The Law of Supply and Demand //////////
I define the Demand as volume that is larger than the previous volume and has close > open bar.
I define the Supply as volume that is larger than the previous volume and has close <= open bar.
Volume Flow is value difference between Demand MA and Supply MA.
I imitate the idea of "Volume Flow v3" by oh92.

///////// The Law of Cause and Effect //////////
Enough volume(Cause) makes reliable price movement(Effect).
If there is not enough volume, its price movement is suspicious.
I define enough volume as volume that is larger than previous volume.
I define large volume as volume that is larger than previous volume and over volume MA(using all volume).
I define "not enough volume" as volume that is smaller than previous volume.
I borrowed the idea from "The Lie Detector" by LucF.
Enough volume(increasing volume) is painted by dark color and Large volume(increasing volume and over volume MA) is painted by light color.
"Not enough volume"(decreasing volume) is painted by empty color(default is black).
This coloring are reflected to price candles.
So, you need {Chart settings} → {Symbol} → {body} ,{Borders} and {Wick} are set dark color, to easier to identify the color of candles.

///////// The Law of Effort and Result //////////
If volume (effort) cannot move price (result), it may be Absorption(potential reversal).
"Factor of Volume Density" determines the threshold of Absorption.
Small Absorption is displayed by gray square at bottom.
Large Absorption is displayed by white square at bottom.

///////// Volume Spike //////////
Volume Spike sometimes precede or confirm trend direction.
"Factor of Volume Spike" determines the threshold of Volume Spike.
Volume Spike is displayed by light bulb.

I made similar style volume indicator and added concept of Laws of Wyckoff.
caution : You need {Chart settings} → {Appearance} → {Bottom margin} is set 0 %, to make chart look good.
: You need {Chart settings} → {Symbol} → {body} ,{Borders} and {Wick} are set dark color, to easier to identify the color of candles.
This 3 Laws of Wyckoff are my interpretation, not the original.
///////// The Law of Supply and Demand //////////
I define the Demand as volume that is larger than the previous volume and has close > open bar.
I define the Supply as volume that is larger than the previous volume and has close <= open bar.
Volume Flow is value difference between Demand MA and Supply MA.
I imitate the idea of "Volume Flow v3" by oh92.
///////// The Law of Cause and Effect //////////
Enough volume(Cause) makes reliable price movement(Effect).
If there is not enough volume, its price movement is suspicious.
I define enough volume as volume that is larger than previous volume.
I define large volume as volume that is larger than previous volume and over volume MA(using all volume).
I define "not enough volume" as volume that is smaller than previous volume.
I borrowed the idea from "The Lie Detector" by LucF.
Enough volume(increasing volume) is painted by dark color and Large volume(increasing volume and over volume MA) is painted by light color.
"Not enough volume"(decreasing volume) is painted by empty color(default is black).
This coloring are reflected to price candles.
So, you need {Chart settings} → {Symbol} → {body} ,{Borders} and {Wick} are set dark color, to easier to identify the color of candles.
///////// The Law of Effort and Result //////////
If volume (effort) cannot move price (result), it may be Absorption(potential reversal).
"Factor of Volume Density" determines the threshold of Absorption.
Small Absorption is displayed by gray square at bottom.
Large Absorption is displayed by white square at bottom.
///////// Volume Spike //////////
Volume Spike sometimes precede or confirm trend direction.
"Factor of Volume Spike" determines the threshold of Volume Spike.
Volume Spike is displayed by light bulb.
릴리즈 노트
fixed spell mistake.릴리즈 노트
If You want to use this script as normal style(separated pane), right click this indicator and "Move to" New pane below, and then turn off "Scale Adjustment" from this indicator's settings{Style}.
릴리즈 노트
added No Demand / Supply candle and TR Spike.릴리즈 노트
Major update !!오픈 소스 스크립트
트레이딩뷰의 진정한 정신에 따라, 이 스크립트의 작성자는 이를 오픈소스로 공개하여 트레이더들이 기능을 검토하고 검증할 수 있도록 했습니다. 작성자에게 찬사를 보냅니다! 이 코드는 무료로 사용할 수 있지만, 코드를 재게시하는 경우 하우스 룰이 적용된다는 점을 기억하세요.
면책사항
해당 정보와 게시물은 금융, 투자, 트레이딩 또는 기타 유형의 조언이나 권장 사항으로 간주되지 않으며, 트레이딩뷰에서 제공하거나 보증하는 것이 아닙니다. 자세한 내용은 이용 약관을 참조하세요.
오픈 소스 스크립트
트레이딩뷰의 진정한 정신에 따라, 이 스크립트의 작성자는 이를 오픈소스로 공개하여 트레이더들이 기능을 검토하고 검증할 수 있도록 했습니다. 작성자에게 찬사를 보냅니다! 이 코드는 무료로 사용할 수 있지만, 코드를 재게시하는 경우 하우스 룰이 적용된다는 점을 기억하세요.
면책사항
해당 정보와 게시물은 금융, 투자, 트레이딩 또는 기타 유형의 조언이나 권장 사항으로 간주되지 않으며, 트레이딩뷰에서 제공하거나 보증하는 것이 아닙니다. 자세한 내용은 이용 약관을 참조하세요.