OPEN-SOURCE SCRIPT
Normalized ROC²
Normalized Rate of Change of Rate of Change (ROC²) Histogram
Overview
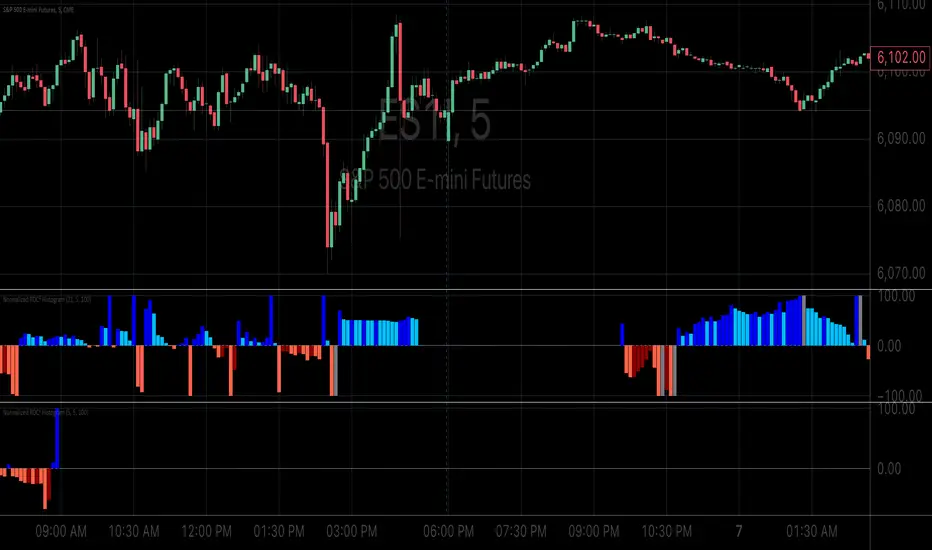
The Normalized ROC² Histogram is a momentum-based indicator designed to detect potential trend reversals by measuring the rate of change of the rate of change of price (the second derivative of price movement). This provides insight into when momentum is slowing down, signaling that a price reversal may be approaching.
The indicator also dynamically changes color to highlight shifts in momentum strength, allowing traders to visualize when price acceleration is increasing or decreasing.
How It Works
🔹 Zero Line Crossovers → Potential Direction Change
• When the histogram approaches zero and crosses over, it suggests that price momentum is shifting and a reversal may be imminent.
• Positive to Negative Crossover: Bearish momentum shift.
• Negative to Positive Crossover: Bullish momentum shift.
🔹 Momentum Strength Visualization → Color Shift
• Dark Blue (⬆️ Increasing Positive Momentum) → Price is accelerating upward.
• Light Blue (🔽 Decreasing Positive Momentum) → Uptrend is weakening.
• Dark Red (⬇️ Increasing Negative Momentum) → Price is accelerating downward.
• Light Red (🔼 Decreasing Negative Momentum) → Downtrend is weakening.
🔹 Normalization for Cleaner Visualization
• Prevents extreme volatility spikes from distorting the histogram.
• Normalizes values on a 0 to 100 scale, ensuring consistent bar height.
How to Use It
✅ Watch for Crossovers Near Zero → These can indicate a trend reversal is forming.
✅ Observe Color Changes → A shift from dark to light signals a deceleration, which often precedes price turning points.
✅ Combine with Other Indicators → Works well with Volume Profile, Moving Averages, and Market Structure analysis.
Why This Indicator is Unique
🚀 Second-derivative momentum detection → Provides early insight into potential price shifts.
📊 Normalized bars prevent distortion → No more extreme spikes ruining the scale.
🎯 Color-coded visual cues → Instantly see when momentum is gaining or fading.
📌 Add the Normalized ROC² Histogram to your charts today to detect potential reversals and momentum shifts in real-time! 🚀
Overview
The Normalized ROC² Histogram is a momentum-based indicator designed to detect potential trend reversals by measuring the rate of change of the rate of change of price (the second derivative of price movement). This provides insight into when momentum is slowing down, signaling that a price reversal may be approaching.
The indicator also dynamically changes color to highlight shifts in momentum strength, allowing traders to visualize when price acceleration is increasing or decreasing.
How It Works
🔹 Zero Line Crossovers → Potential Direction Change
• When the histogram approaches zero and crosses over, it suggests that price momentum is shifting and a reversal may be imminent.
• Positive to Negative Crossover: Bearish momentum shift.
• Negative to Positive Crossover: Bullish momentum shift.
🔹 Momentum Strength Visualization → Color Shift
• Dark Blue (⬆️ Increasing Positive Momentum) → Price is accelerating upward.
• Light Blue (🔽 Decreasing Positive Momentum) → Uptrend is weakening.
• Dark Red (⬇️ Increasing Negative Momentum) → Price is accelerating downward.
• Light Red (🔼 Decreasing Negative Momentum) → Downtrend is weakening.
🔹 Normalization for Cleaner Visualization
• Prevents extreme volatility spikes from distorting the histogram.
• Normalizes values on a 0 to 100 scale, ensuring consistent bar height.
How to Use It
✅ Watch for Crossovers Near Zero → These can indicate a trend reversal is forming.
✅ Observe Color Changes → A shift from dark to light signals a deceleration, which often precedes price turning points.
✅ Combine with Other Indicators → Works well with Volume Profile, Moving Averages, and Market Structure analysis.
Why This Indicator is Unique
🚀 Second-derivative momentum detection → Provides early insight into potential price shifts.
📊 Normalized bars prevent distortion → No more extreme spikes ruining the scale.
🎯 Color-coded visual cues → Instantly see when momentum is gaining or fading.
📌 Add the Normalized ROC² Histogram to your charts today to detect potential reversals and momentum shifts in real-time! 🚀
오픈 소스 스크립트
트레이딩뷰의 진정한 정신에 따라, 이 스크립트의 작성자는 이를 오픈소스로 공개하여 트레이더들이 기능을 검토하고 검증할 수 있도록 했습니다. 작성자에게 찬사를 보냅니다! 이 코드는 무료로 사용할 수 있지만, 코드를 재게시하는 경우 하우스 룰이 적용된다는 점을 기억하세요.
I provide expert guidance for crypto traders using Volume Profile and pattern recognition tech
면책사항
해당 정보와 게시물은 금융, 투자, 트레이딩 또는 기타 유형의 조언이나 권장 사항으로 간주되지 않으며, 트레이딩뷰에서 제공하거나 보증하는 것이 아닙니다. 자세한 내용은 이용 약관을 참조하세요.