OPEN-SOURCE SCRIPT
CAPM Calculator [TrendX_]
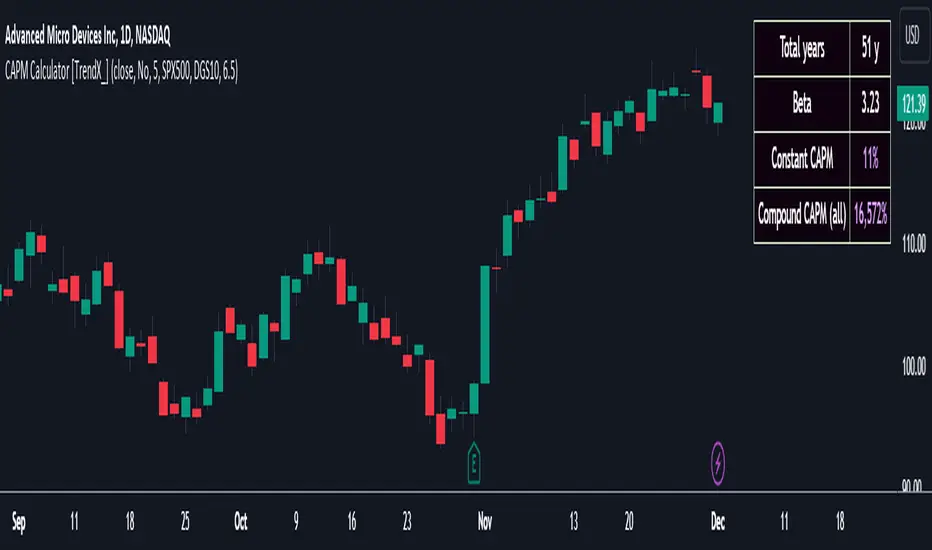
CAPM calculator is a powerful tool that helps find the cost of equity, which is the minimum return that shareholders require to invest in a company.
With the CAPM calculator, you can assess how well your trading strategy performs compared to the market. The goal of your strategy is to earn higher returns than what you would get by investing in the market with the same level of risk. This is called the risk-adjusted cost of capital, and it represents the minimum return that you should accept for your investment.
USAGE
A simple way to measure this is to compare the Compound annual growth rate (CAGR) of the trading strategy with the “Compound CAPM”, which is the CAGR of investing in the market with the same beta as the strategy.
If the trading strategy has a higher CAGR than the “Compound CAPM”, it means that it has outperformed the market on a risk-adjusted basis.
This is a sign of an effective trading strategy.
DISCLAIMER
The results achieved in the past are not all reliable sources of what will happen in the future. There are many factors and uncertainties that can affect the outcome of any endeavor, and no one can guarantee or predict with certainty what will occur.
Therefore, you should always exercise caution and judgment when making decisions based on past performance.
오픈 소스 스크립트
트레이딩뷰의 진정한 정신에 따라, 이 스크립트의 작성자는 이를 오픈소스로 공개하여 트레이더들이 기능을 검토하고 검증할 수 있도록 했습니다. 작성자에게 찬사를 보냅니다! 이 코드는 무료로 사용할 수 있지만, 코드를 재게시하는 경우 하우스 룰이 적용된다는 점을 기억하세요.
면책사항
해당 정보와 게시물은 금융, 투자, 트레이딩 또는 기타 유형의 조언이나 권장 사항으로 간주되지 않으며, 트레이딩뷰에서 제공하거나 보증하는 것이 아닙니다. 자세한 내용은 이용 약관을 참조하세요.
오픈 소스 스크립트
트레이딩뷰의 진정한 정신에 따라, 이 스크립트의 작성자는 이를 오픈소스로 공개하여 트레이더들이 기능을 검토하고 검증할 수 있도록 했습니다. 작성자에게 찬사를 보냅니다! 이 코드는 무료로 사용할 수 있지만, 코드를 재게시하는 경우 하우스 룰이 적용된다는 점을 기억하세요.
면책사항
해당 정보와 게시물은 금융, 투자, 트레이딩 또는 기타 유형의 조언이나 권장 사항으로 간주되지 않으며, 트레이딩뷰에서 제공하거나 보증하는 것이 아닙니다. 자세한 내용은 이용 약관을 참조하세요.