OPEN-SOURCE SCRIPT
RTH Session Range Position (0-100) with EMA

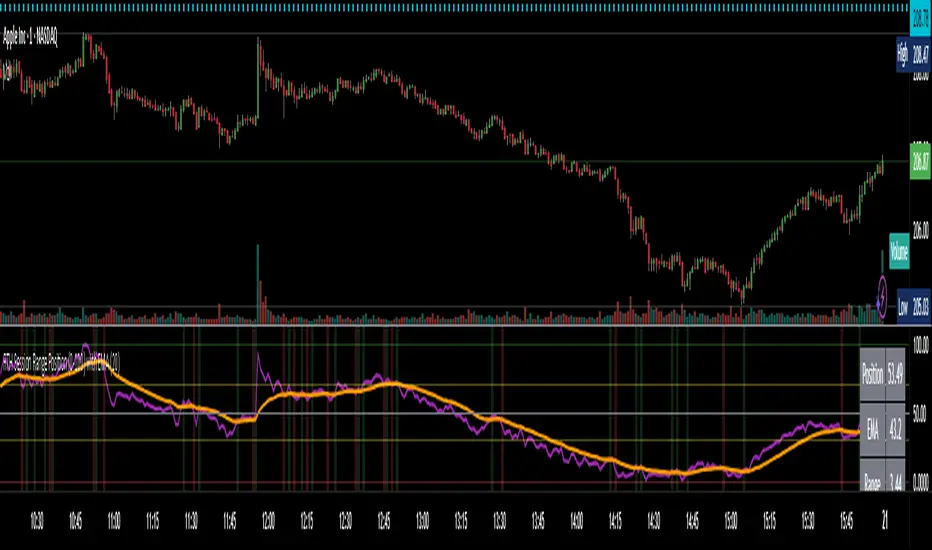
A Pine Script indicator designed to help traders understand where the current price is located within the Regular Trading Hours (RTH) session range, from 0 (session low) to 100 (session high). It also plots a smoothed EMA of this position to provide insight into momentum or trend during the RTH session.
What the Indicator Does
Defines RTH (Regular Trading Hours):
Tracks the session's high and low during RTH:
Calculates position of the current price within the RTH range:
Calculates an EMA of that position (posEMA):
Plots and table:
Visual cues:
Alerts:
How to Use It Effectively
1. Session Strength & Momentum
2. Breakout or Reversal Detection
3. Range Context for Entries
If you're a mean-reversion trader, look for:
Price > 70 + turning down below EMA → possible short.
Price < 30 + turning up above EMA → possible long.
For breakout traders, you might wait for:
Crosses above 70 with EMA support.
Crosses below 30 with EMA resistance.
4. Confirmation Tool
Use this indicator alongside others to confirm:
What the Indicator Does
Defines RTH (Regular Trading Hours):
- Start: 9:30 AM
- End: 4:00 PM
- These are typical US equity market hours.
Tracks the session's high and low during RTH:
- sessionHigh and sessionLow update only during RTH.
Calculates position of the current price within the RTH range:
- Formula: ((close - sessionLow) / (sessionHigh - sessionLow)) * 100
- Result is a percentage:
- 0 = at session low
- 100 = at session high
- 50 = middle of session range
Calculates an EMA of that position (posEMA):
- Smooths out the raw position to help visualize momentum within the range.
Plots and table:
- Plots pos and posEMA on a separate chart pane.
- Adds horizontal lines at key levels (0, 30, 50, 70, 100).
- Table shows current values for Position, EMA, and Range.
Visual cues:
- bgcolor highlights when pos crosses over or under the EMA — potential momentum shifts.
Alerts:
- Cross above/below 50 (session midpoint).
- Cross above/below EMA.
How to Use It Effectively
1. Session Strength & Momentum
- Position above 70: Price is near session highs — strong upward momentum.
- Position below 30: Price is near session lows — strong downward momentum.
- Use the EMA of position to filter out noise and identify trends.
2. Breakout or Reversal Detection
- Cross above EMA: Momentum may be turning bullish.
- Cross below EMA: Momentum may be turning bearish.
- These crosses (especially near mid-levels like 50) can hint at session trend shifts.
3. Range Context for Entries
If you're a mean-reversion trader, look for:
Price > 70 + turning down below EMA → possible short.
Price < 30 + turning up above EMA → possible long.
For breakout traders, you might wait for:
Crosses above 70 with EMA support.
Crosses below 30 with EMA resistance.
4. Confirmation Tool
Use this indicator alongside others to confirm:
- Whether price action has strength within the day.
- Whether breakouts have real momentum or are extended already.
오픈 소스 스크립트
트레이딩뷰의 진정한 정신에 따라, 이 스크립트의 작성자는 이를 오픈소스로 공개하여 트레이더들이 기능을 검토하고 검증할 수 있도록 했습니다. 작성자에게 찬사를 보냅니다! 이 코드는 무료로 사용할 수 있지만, 코드를 재게시하는 경우 하우스 룰이 적용된다는 점을 기억하세요.
면책사항
해당 정보와 게시물은 금융, 투자, 트레이딩 또는 기타 유형의 조언이나 권장 사항으로 간주되지 않으며, 트레이딩뷰에서 제공하거나 보증하는 것이 아닙니다. 자세한 내용은 이용 약관을 참조하세요.
오픈 소스 스크립트
트레이딩뷰의 진정한 정신에 따라, 이 스크립트의 작성자는 이를 오픈소스로 공개하여 트레이더들이 기능을 검토하고 검증할 수 있도록 했습니다. 작성자에게 찬사를 보냅니다! 이 코드는 무료로 사용할 수 있지만, 코드를 재게시하는 경우 하우스 룰이 적용된다는 점을 기억하세요.
면책사항
해당 정보와 게시물은 금융, 투자, 트레이딩 또는 기타 유형의 조언이나 권장 사항으로 간주되지 않으며, 트레이딩뷰에서 제공하거나 보증하는 것이 아닙니다. 자세한 내용은 이용 약관을 참조하세요.