OPEN-SOURCE SCRIPT
Forex Pips Tracker Pinescriptlabs
This algorithm is exclusively designed for the Forex market 🌐 and serves as a tool to measure volatility, helping to determine on average how many pips positions move per hour. With this information, a trader can place take profit and stop loss orders with greater certainty, since they know the average pip movement range during each hour of the day.
What does it do and how does it work?
• Volatility measurement in pips 📊:
The algorithm calculates the size of the movement (or range) of each candle expressed in pips. To do this, it takes the difference between the highest and lowest price of each candle and converts it into pips.
👉
• Time zone adjustment ⏰:
It allows you to configure the time zone so that the data aligns with your desired schedule. This is especially useful for comparing movements at different times based on the trader's location.
• Analysis by time intervals 🕒:
The algorithm’s logic organizes the information for each hour of the day. It stores data for the current day, the previous day, weekly, and historically (200 candles). This allows you to see how volatility varies across different periods, providing a dynamic view of market behavior.
👉
• Directionality of movement 🔄:
In addition to averaging the pip range, the algorithm determines the predominant direction of each candle (bullish or bearish). This translates into visual indicators (like arrows) that help identify whether, on average, the movement during that hour tends to go up or down.
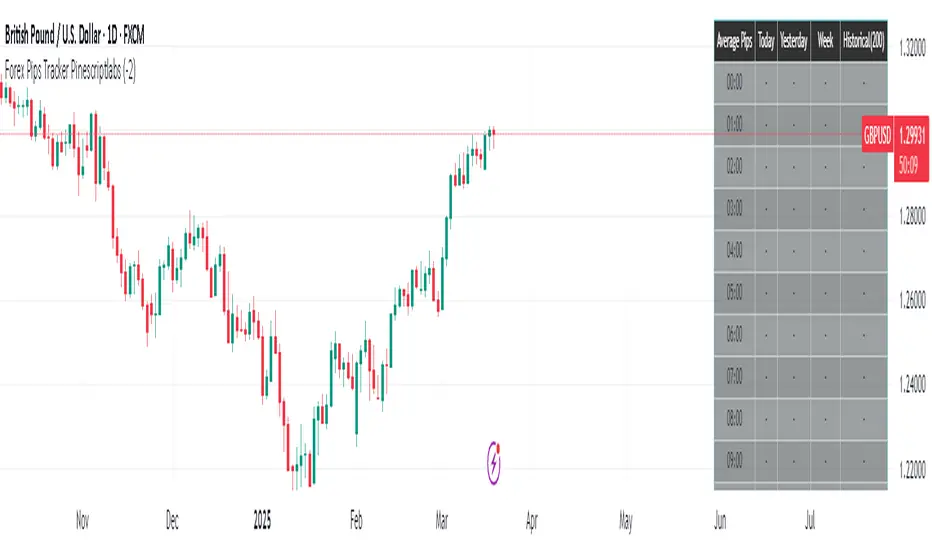
• Table visualization 📈:
Finally, the information is presented in an integrated table on the chart. Each row corresponds to an hour of the day and shows the average number of pips and the direction (bullish, bearish, or neutral) for each analyzed period. This table makes it easy to quickly and practically interpret the volatility data.
By combining these features, the algorithm becomes an essential tool for traders looking to better understand market dynamics and optimize their trading strategies! 💼✨
Español:
Este algoritmo está diseñado exclusivamente para el mercado Forex 🌐 y sirve como una herramienta para medir la volatilidad, ayudando a determinar en promedio cuántos pips se mueven las posiciones por hora. Con esta información, un trader puede colocar el take profit y el stop loss con mayor certeza, ya que conoce el rango promedio de movimiento en pips durante cada hora del día.
¿Qué hace y cómo funciona?
• Medición de volatilidad en pips 📊:
El algoritmo calcula el tamaño del movimiento (o rango) de cada vela expresado en pips. Para ello, toma la diferencia entre el precio máximo y el mínimo de cada vela y la convierte a pips.
👉
• Ajuste de zona horaria ⏰:
Permite configurar la zona horaria para que los datos se ajusten al horario deseado. Esto es especialmente útil para comparar movimientos durante distintas horas en función de la localización del trader.
• Análisis por intervalos de tiempo 🕒:
La lógica del algoritmo organiza la información por cada hora del día. Guarda datos para el día actual, el día anterior, a nivel semanal e histórico (200 velas). Esto permite ver cómo varía la volatilidad en diferentes periodos, proporcionando una visión dinámica del comportamiento del mercado.
👉
• Direccionalidad del movimiento 🔄:
Además de promediar el rango en pips, el algoritmo determina la dirección predominante de cada vela (alcista o bajista). Esto se traduce en indicadores visuales (como flechas) que permiten identificar si, en promedio, el movimiento en esa hora tiende a subir o bajar.
• Visualización en tabla 📈:
Finalmente, la información se presenta en una tabla integrada en el gráfico. Cada fila corresponde a una hora del día y muestra el promedio de pips y la dirección (alcista, bajista o neutral) para cada uno de los periodos analizados. Esta tabla facilita la interpretación rápida y práctica de los datos de volatilidad.
Al combinar estas funciones, el algoritmo se convierte en una herramienta esencial para traders que buscan entender mejor la dinámica del mercado y optimizar sus estrategias de trading! 💼✨
What does it do and how does it work?
• Volatility measurement in pips 📊:
The algorithm calculates the size of the movement (or range) of each candle expressed in pips. To do this, it takes the difference between the highest and lowest price of each candle and converts it into pips.
👉
• Time zone adjustment ⏰:
It allows you to configure the time zone so that the data aligns with your desired schedule. This is especially useful for comparing movements at different times based on the trader's location.
• Analysis by time intervals 🕒:
The algorithm’s logic organizes the information for each hour of the day. It stores data for the current day, the previous day, weekly, and historically (200 candles). This allows you to see how volatility varies across different periods, providing a dynamic view of market behavior.
👉
• Directionality of movement 🔄:
In addition to averaging the pip range, the algorithm determines the predominant direction of each candle (bullish or bearish). This translates into visual indicators (like arrows) that help identify whether, on average, the movement during that hour tends to go up or down.
• Table visualization 📈:
Finally, the information is presented in an integrated table on the chart. Each row corresponds to an hour of the day and shows the average number of pips and the direction (bullish, bearish, or neutral) for each analyzed period. This table makes it easy to quickly and practically interpret the volatility data.
By combining these features, the algorithm becomes an essential tool for traders looking to better understand market dynamics and optimize their trading strategies! 💼✨
Español:
Este algoritmo está diseñado exclusivamente para el mercado Forex 🌐 y sirve como una herramienta para medir la volatilidad, ayudando a determinar en promedio cuántos pips se mueven las posiciones por hora. Con esta información, un trader puede colocar el take profit y el stop loss con mayor certeza, ya que conoce el rango promedio de movimiento en pips durante cada hora del día.
¿Qué hace y cómo funciona?
• Medición de volatilidad en pips 📊:
El algoritmo calcula el tamaño del movimiento (o rango) de cada vela expresado en pips. Para ello, toma la diferencia entre el precio máximo y el mínimo de cada vela y la convierte a pips.
👉
• Ajuste de zona horaria ⏰:
Permite configurar la zona horaria para que los datos se ajusten al horario deseado. Esto es especialmente útil para comparar movimientos durante distintas horas en función de la localización del trader.
• Análisis por intervalos de tiempo 🕒:
La lógica del algoritmo organiza la información por cada hora del día. Guarda datos para el día actual, el día anterior, a nivel semanal e histórico (200 velas). Esto permite ver cómo varía la volatilidad en diferentes periodos, proporcionando una visión dinámica del comportamiento del mercado.
👉
• Direccionalidad del movimiento 🔄:
Además de promediar el rango en pips, el algoritmo determina la dirección predominante de cada vela (alcista o bajista). Esto se traduce en indicadores visuales (como flechas) que permiten identificar si, en promedio, el movimiento en esa hora tiende a subir o bajar.
• Visualización en tabla 📈:
Finalmente, la información se presenta en una tabla integrada en el gráfico. Cada fila corresponde a una hora del día y muestra el promedio de pips y la dirección (alcista, bajista o neutral) para cada uno de los periodos analizados. Esta tabla facilita la interpretación rápida y práctica de los datos de volatilidad.
Al combinar estas funciones, el algoritmo se convierte en una herramienta esencial para traders que buscan entender mejor la dinámica del mercado y optimizar sus estrategias de trading! 💼✨
오픈 소스 스크립트
트레이딩뷰의 진정한 정신에 따라, 이 스크립트의 작성자는 이를 오픈소스로 공개하여 트레이더들이 기능을 검토하고 검증할 수 있도록 했습니다. 작성자에게 찬사를 보냅니다! 이 코드는 무료로 사용할 수 있지만, 코드를 재게시하는 경우 하우스 룰이 적용된다는 점을 기억하세요.
면책사항
해당 정보와 게시물은 금융, 투자, 트레이딩 또는 기타 유형의 조언이나 권장 사항으로 간주되지 않으며, 트레이딩뷰에서 제공하거나 보증하는 것이 아닙니다. 자세한 내용은 이용 약관을 참조하세요.
오픈 소스 스크립트
트레이딩뷰의 진정한 정신에 따라, 이 스크립트의 작성자는 이를 오픈소스로 공개하여 트레이더들이 기능을 검토하고 검증할 수 있도록 했습니다. 작성자에게 찬사를 보냅니다! 이 코드는 무료로 사용할 수 있지만, 코드를 재게시하는 경우 하우스 룰이 적용된다는 점을 기억하세요.
면책사항
해당 정보와 게시물은 금융, 투자, 트레이딩 또는 기타 유형의 조언이나 권장 사항으로 간주되지 않으며, 트레이딩뷰에서 제공하거나 보증하는 것이 아닙니다. 자세한 내용은 이용 약관을 참조하세요.