OPEN-SOURCE SCRIPT
업데이트됨 Relative Strength of a stock
Determine the relative strength of a stock vis-a-vis a larger benchmark. Default is NIFTY50.
릴리즈 노트
Cosmetic changes to make the display pretty and input choices in more logical sequence.릴리즈 노트
This version adds input as source type. So you can compare typical values, amongst other input values. Some cosmetic changes also naming of the plots etc.릴리즈 노트
- Added colour coding of crossover RS
- Added label to mark reference date based on length input from the last bar
릴리즈 노트
- Beautified the input dialog
- Added Support to plot trend on RS line
The trend on RS line is the arctan value of current bar to previous range (default 5 bars) back. If the radians is positive a green colour zero line is plotted else maroon is plotted.
릴리즈 노트
- Pine script version 5
- NBC: Default length of SMA for RS changed to 50 from 61
- Added price-action indication for added confirmation along with RS, Provision to switch-off this completely from input dialog
Inputs for Price Confirmation
check box = Checked means enabled (default), uncheck to turn-off full feature
Period = Keep default value. Length on SMA for price confirmation.
Green color selector +ve = Bullish color and transparency selector
Red color selector -ve = Bearish color and transparency selector
=============================================================
Description of Price Confirmation behavior
=============================================================
In addition to the existing RS behavior, it is now possible to superimpose price-action behavior on the RS line.
As per existing RS, RS above zero indicates outperformance/strength over the selected benchmark and RS below zero indicates underperformance/weakness over the selected benchmark for the selected period.
Now, added a simple logic for price-action (check code for details)
If one uses price-action with RS, it is possible better manage the trade, time the entry and book partial profits or exit.
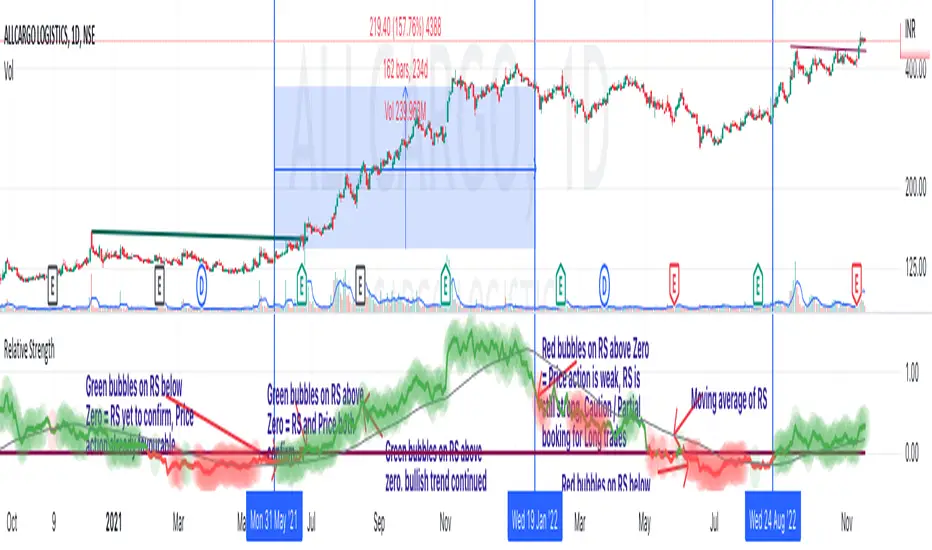
Price action is indicated by bubbles over the RS line. Green bubbles = Bullish Price Action. Red bubbles = Bearish Price Action.
When
RS is above zero and we have Green bubbles ==> Bullish trend in both price action and RS
RS is below zero and we have Red bubbles ==> Bearish trend in both price action and RS
RS is above zero and we have Red bubbles ==> Caution on the Bullish RS, ripe for profit booking, full exit or just caution.
RS is below zero and we have Green bubbles ==> Price indicating bullishness, RS yet to turn positive. Ripe for tracking position, partial entry, promotion in watchlist etc.
릴리즈 노트
- Show trend color on RS MA
If the trend for moving average of RS is rising for 3 periods, plot in green. If falling for 3 periods, plot in red. Default is blue.
릴리즈 노트
- Pine script update to version 6
- alertconditions for screener
오픈 소스 스크립트
트레이딩뷰의 진정한 정신에 따라, 이 스크립트의 작성자는 이를 오픈소스로 공개하여 트레이더들이 기능을 검토하고 검증할 수 있도록 했습니다. 작성자에게 찬사를 보냅니다! 이 코드는 무료로 사용할 수 있지만, 코드를 재게시하는 경우 하우스 룰이 적용된다는 점을 기억하세요.
면책사항
해당 정보와 게시물은 금융, 투자, 트레이딩 또는 기타 유형의 조언이나 권장 사항으로 간주되지 않으며, 트레이딩뷰에서 제공하거나 보증하는 것이 아닙니다. 자세한 내용은 이용 약관을 참조하세요.
오픈 소스 스크립트
트레이딩뷰의 진정한 정신에 따라, 이 스크립트의 작성자는 이를 오픈소스로 공개하여 트레이더들이 기능을 검토하고 검증할 수 있도록 했습니다. 작성자에게 찬사를 보냅니다! 이 코드는 무료로 사용할 수 있지만, 코드를 재게시하는 경우 하우스 룰이 적용된다는 점을 기억하세요.
면책사항
해당 정보와 게시물은 금융, 투자, 트레이딩 또는 기타 유형의 조언이나 권장 사항으로 간주되지 않으며, 트레이딩뷰에서 제공하거나 보증하는 것이 아닙니다. 자세한 내용은 이용 약관을 참조하세요.