PROTECTED SOURCE SCRIPT
Sumits EMA Clouds (Modified)
Overview
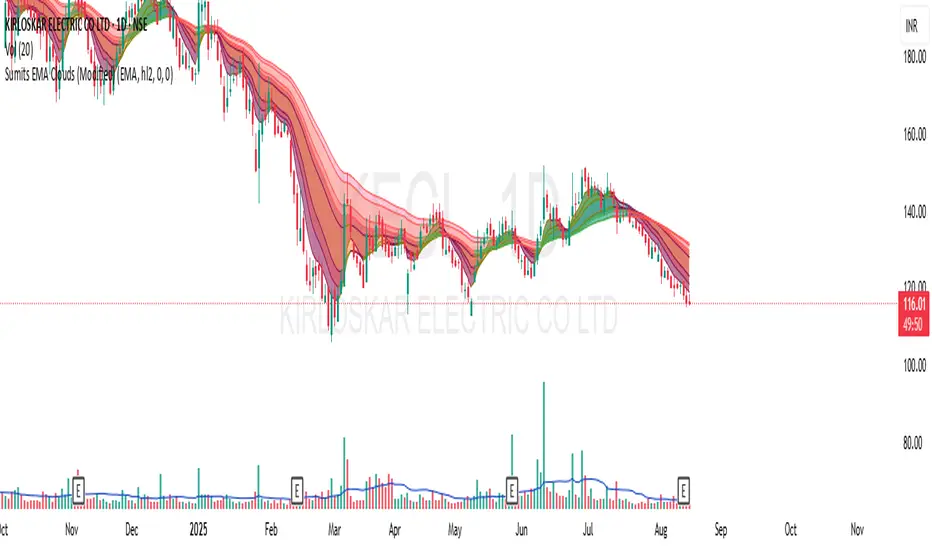
Sumit’s EMA Clouds (Modified) is a versatile trend-tracking and momentum-visualization tool designed for TradingView.
It overlays multiple exponential (or simple) moving average (MA) clouds directly on the price chart, helping traders quickly assess trend direction, strength, and possible reversal zones.
The indicator combines short-term and long-term MA pairs into “clouds,” color-coded for bullish or bearish bias, making it easy to interpret market structure at a glance.
Key Features
Customizable MA Type
Option to switch between EMA and SMA for all calculations.
Adjustable price source (default: (high + low) / 2) for fine-tuning.
Five Independent EMA Clouds
Cloud 1: EMA 5 vs EMA 30
Cloud 2: EMA 9 vs EMA 34
Cloud 3: EMA 13 vs EMA 45
Cloud 4: EMA 26 vs EMA 50
Cloud 5: EMA 26 vs EMA 200 (for major trend bias)
Trend-Based Coloring
Cloud Fill Color: Turns green/blue when the short MA is above the long MA (bullish bias), red/orange/pink when below (bearish bias).
Line Color: Adapts dynamically to the MA’s slope — olive/green for upward momentum, maroon/red for downward.
Toggle Visibility
Option to hide/show individual EMA clouds.
Option to hide/show MA lines while keeping only the shaded clouds for a cleaner look.
Offset & Leading Display
Ability to offset plotted MAs to project them forward for visual clarity or predictive modeling.
Trading Applications
Trend Confirmation:
Clouds expanding with bullish colors indicate strengthening upward trends; contracting or color-flipping clouds may signal reversals.
Dynamic Support/Resistance:
Price often reacts to cloud boundaries; the thicker the cloud, the stronger the zone.
Multi-Timeframe Consistency:
Works well across intraday, swing, and positional setups — shorter clouds for quick trades, longer clouds for macro trend guidance.
Momentum Visualization:
Changing slope colors give early hints of acceleration or weakening momentum.
How to Interpret
All Clouds Bullish (aligned & greenish):
Strong uptrend — consider trend-following entries.
All Clouds Bearish (aligned & reddish):
Strong downtrend — look for shorting opportunities.
Mixed Signals (clouds crossing in different directions):
Possible trend exhaustion or consolidation — avoid over-aggressive entries.
200 EMA Cloud (Cloud 5):
Acts as a “macro trend filter” — many traders only trade in the direction of this cloud.
보호된 스크립트입니다
이 스크립트는 비공개 소스로 게시됩니다. 하지만 이를 자유롭게 제한 없이 사용할 수 있습니다 – 자세한 내용은 여기에서 확인하세요.
면책사항
해당 정보와 게시물은 금융, 투자, 트레이딩 또는 기타 유형의 조언이나 권장 사항으로 간주되지 않으며, 트레이딩뷰에서 제공하거나 보증하는 것이 아닙니다. 자세한 내용은 이용 약관을 참조하세요.
보호된 스크립트입니다
이 스크립트는 비공개 소스로 게시됩니다. 하지만 이를 자유롭게 제한 없이 사용할 수 있습니다 – 자세한 내용은 여기에서 확인하세요.
면책사항
해당 정보와 게시물은 금융, 투자, 트레이딩 또는 기타 유형의 조언이나 권장 사항으로 간주되지 않으며, 트레이딩뷰에서 제공하거나 보증하는 것이 아닙니다. 자세한 내용은 이용 약관을 참조하세요.