OPEN-SOURCE SCRIPT
Volatility Price Range
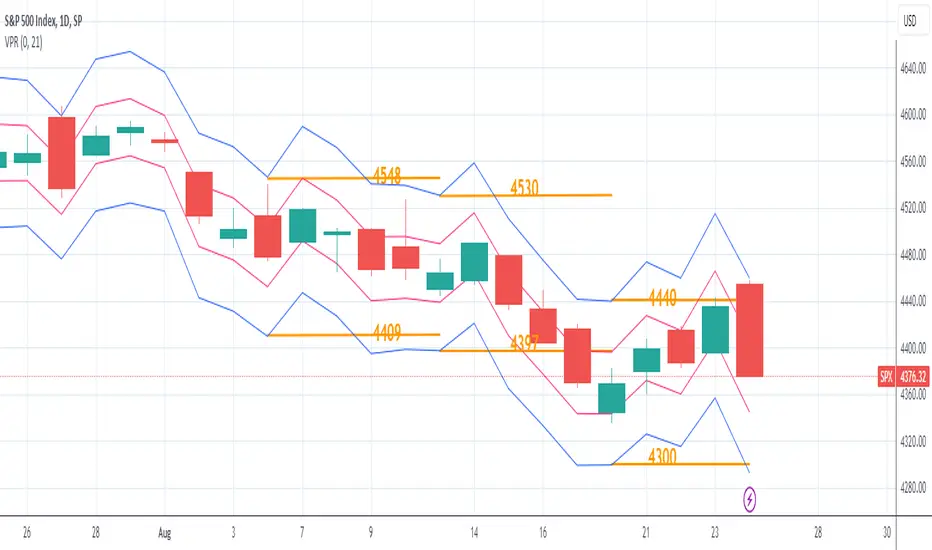
The Volatility Price Range is an overlay which estimates a price range for the next seven days and next day, based on historical volatility (already available in TradingView). The upper and lower bands are calculated as follows:
The Volatility for one week is calculated using the formula: WV = HV * √t where:
WV: one-week volatility
HV: annual volatility
√: square root
t: the time factor expressed in years
From this formula we can deduce the weekly volatility WV = HV * √(1 / 52) = HV / 7.2 where 52: weeks in a year.
The daily volatility DV = HV * √(1 / 365) = HV / 19.1 where 365: days in a year.
To calculate the lower and upper value of the bands, the weekly/daily volatility value obtained will be subtracted/added from/to the current price.
오픈 소스 스크립트
트레이딩뷰의 진정한 정신에 따라, 이 스크립트의 작성자는 이를 오픈소스로 공개하여 트레이더들이 기능을 검토하고 검증할 수 있도록 했습니다. 작성자에게 찬사를 보냅니다! 이 코드는 무료로 사용할 수 있지만, 코드를 재게시하는 경우 하우스 룰이 적용된다는 점을 기억하세요.
면책사항
해당 정보와 게시물은 금융, 투자, 트레이딩 또는 기타 유형의 조언이나 권장 사항으로 간주되지 않으며, 트레이딩뷰에서 제공하거나 보증하는 것이 아닙니다. 자세한 내용은 이용 약관을 참조하세요.
오픈 소스 스크립트
트레이딩뷰의 진정한 정신에 따라, 이 스크립트의 작성자는 이를 오픈소스로 공개하여 트레이더들이 기능을 검토하고 검증할 수 있도록 했습니다. 작성자에게 찬사를 보냅니다! 이 코드는 무료로 사용할 수 있지만, 코드를 재게시하는 경우 하우스 룰이 적용된다는 점을 기억하세요.
면책사항
해당 정보와 게시물은 금융, 투자, 트레이딩 또는 기타 유형의 조언이나 권장 사항으로 간주되지 않으며, 트레이딩뷰에서 제공하거나 보증하는 것이 아닙니다. 자세한 내용은 이용 약관을 참조하세요.