OPEN-SOURCE SCRIPT
Double Ribbon [ChartPrime]
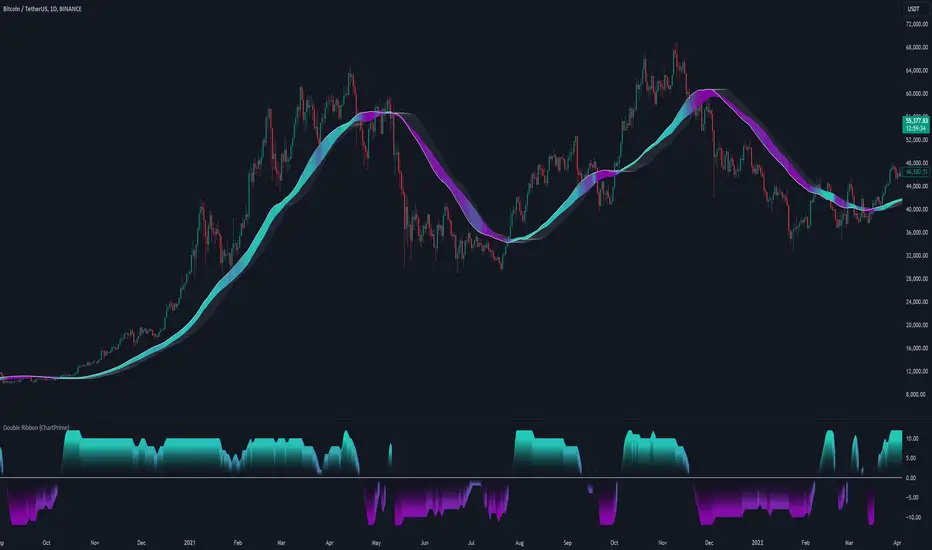
The Double Ribbon - ChartPrime indicator is a powerful tool that combines two sets of Simple Moving Averages (SMAs) into a visually intuitive ribbon, which helps traders assess market trends and momentum. This indicator features two distinct ribbons: one with a fixed length but changing offset (displayed in gray) and another with varying lengths (displayed in colors). The relationship between these ribbons forms the basis of a trend score, which is visualized as an oscillator. This comprehensive approach provides traders with a clear view of market direction and strength.

◆ KEY FEATURES
◆ USAGE
⯁ USER INPUTS
⯁ CONCLUSION
The Double Ribbon [ChartPrime] indicator offers traders a comprehensive tool for analyzing market trends and momentum. By combining two ribbons with varying SMA lengths and offsets, it provides a clear visual representation of market conditions. The trend score oscillator enhances this analysis by quantifying trend strength, making it easier for traders to identify potential trading opportunities and manage risk effectively.
◆ KEY FEATURES
- Dual Ribbon Visualization: Displays two sets of 11 SMAs—one in a neutral gray color with a fixed length but varying offset, and another in vibrant colors with lengths that increase incrementally.
- Trend Score Calculation: The trend score is derived from comparing each SMA in the colored ribbon with its corresponding SMA in the gray ribbon. If a colored SMA is above its gray counterpart, a positive score is added; if below, a negative score is assigned.
Pine Script® // Loop to calculate SMAs and update the score based on their relationships for i = 0 to length // Calculate SMA with increasing lengths sma = ta.sma(src, len + 1 + i) // Update score based on comparison of primary SMA with current SMA if sma1 < sma score += 1 else score -= 1 // Store calculated SMAs in the arrays sma_array.push(sma) sma_array1.push(sma1) - Dynamic Trend Analysis: The score oscillator provides a dynamic analysis of the trend, allowing traders to quickly gauge market conditions and potential reversals.
- Customizable Ribbon Display: Users can toggle the display of the ribbon for a cleaner chart view, focusing solely on the trend score if desired.
◆ USAGE
- Trend Confirmation: Use the position and color of the ribbon to confirm the current market trend. When the colored ribbon consistently stays above the gray ribbon, it indicates a strong uptrend, and vice versa for a downtrend.
- Momentum Assessment: The score oscillator provides insight into the strength of the current trend. Higher scores suggest stronger trends, while lower scores may indicate weakening momentum or a potential reversal.
- Strategic Entry/Exit Points: Consider using crossovers between the ribbons and changes in the score oscillator to identify potential entry or exit points in trades.
⯁ USER INPUTS
- Length: Sets the base length for the primary SMAs in the ribbons.
- Source: Determines the price data used for calculating the SMAs (e.g., close, open).
- Ribbon Display Toggle: Allows users to show or hide the ribbon on the chart, focusing on either the ribbon, the trend score, or both.
⯁ CONCLUSION
The Double Ribbon [ChartPrime] indicator offers traders a comprehensive tool for analyzing market trends and momentum. By combining two ribbons with varying SMA lengths and offsets, it provides a clear visual representation of market conditions. The trend score oscillator enhances this analysis by quantifying trend strength, making it easier for traders to identify potential trading opportunities and manage risk effectively.
오픈 소스 스크립트
트레이딩뷰의 진정한 정신에 따라, 이 스크립트의 작성자는 이를 오픈소스로 공개하여 트레이더들이 기능을 검토하고 검증할 수 있도록 했습니다. 작성자에게 찬사를 보냅니다! 이 코드는 무료로 사용할 수 있지만, 코드를 재게시하는 경우 하우스 룰이 적용된다는 점을 기억하세요.
면책사항
해당 정보와 게시물은 금융, 투자, 트레이딩 또는 기타 유형의 조언이나 권장 사항으로 간주되지 않으며, 트레이딩뷰에서 제공하거나 보증하는 것이 아닙니다. 자세한 내용은 이용 약관을 참조하세요.
오픈 소스 스크립트
트레이딩뷰의 진정한 정신에 따라, 이 스크립트의 작성자는 이를 오픈소스로 공개하여 트레이더들이 기능을 검토하고 검증할 수 있도록 했습니다. 작성자에게 찬사를 보냅니다! 이 코드는 무료로 사용할 수 있지만, 코드를 재게시하는 경우 하우스 룰이 적용된다는 점을 기억하세요.
면책사항
해당 정보와 게시물은 금융, 투자, 트레이딩 또는 기타 유형의 조언이나 권장 사항으로 간주되지 않으며, 트레이딩뷰에서 제공하거나 보증하는 것이 아닙니다. 자세한 내용은 이용 약관을 참조하세요.