OPEN-SOURCE SCRIPT
업데이트됨 [Becak] - Swing Point Retracement & Prediction
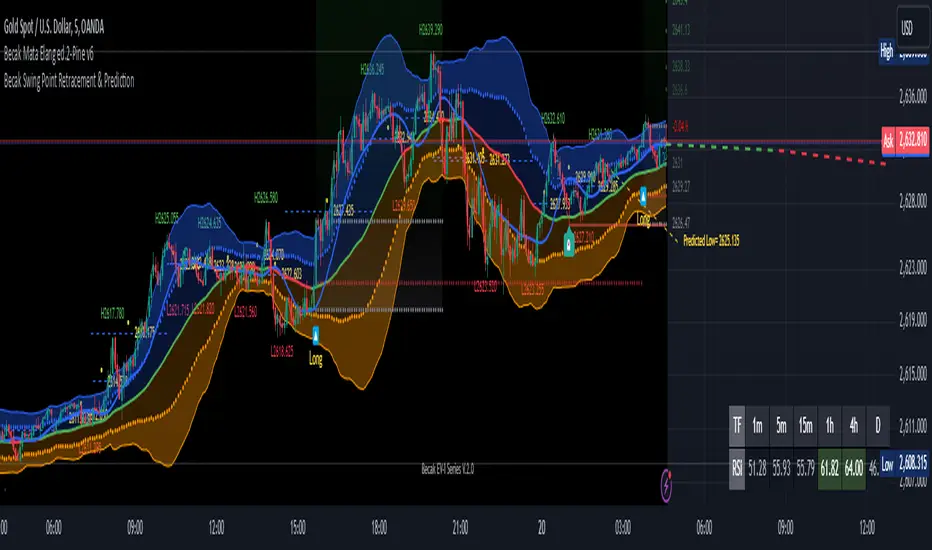
"[Becak] - Swing Point Retracement & Prediction," is designed to identify swing points in price action, calculate retracement levels, and predict potential future price levels. It's a technical analysis tool that can help traders identify potential support and resistance levels, as well as possible reversal points.
HOW IT WORK
Swing Point Detection:
The indicator uses the ta.pivothigh() and ta.pivotlow() functions to identify swing highs and lows within a specified lookback period.
Retracement Levels:
When a new swing point is detected, the indicator calculates a retracement level based on the user-defined retracement percentage. It draws a dashed blue line at the retracement level, along with a yellow circle and a label showing the price.
Swing Point Labeling:
Swing highs are marked with a green "H" label and the price, and Swing lows are marked with a red "L" label and the price.
Price Prediction:
Based on the most recent swing point, the indicator attempts to predict the next potential high or low. It draws a purple dashed line extending into the future, indicating the predicted price level.
HOW TO USE THIS INDICATOR:
adjust the input parameters:
"Swing Point Lookback": Determines how far back the indicator looks to identify swing points. A larger value will result in fewer, more significant swing points.
"Retracement %": Sets the percentage for calculating retracement levels. 50% is a common Fibonacci retracement level, but you can adjust this based on your trading strategy.
"Prediction Length": Determines how far into the future the prediction line extends.
Interpret the results:
Use the swing point labels (H and L) to quickly identify recent highs and lows. The blue dashed lines and yellow circles indicate potential support or resistance levels based on the retracement percentage.The purple dashed line shows a potential future price target. This can be used to set profit targets or identify potential reversal zones.
Combine with other analysis:
This indicator works best when combined with other forms of analysis, such as trend lines, moving averages, or candlestick patterns.
Use the retracement levels and predictions as potential entry or exit points, but always confirm with other indicators or price action signals.
릴리즈 노트
change the color of prediction low and prediction high릴리즈 노트
update to pinescript v6오픈 소스 스크립트
트레이딩뷰의 진정한 정신에 따라, 이 스크립트의 작성자는 이를 오픈소스로 공개하여 트레이더들이 기능을 검토하고 검증할 수 있도록 했습니다. 작성자에게 찬사를 보냅니다! 이 코드는 무료로 사용할 수 있지만, 코드를 재게시하는 경우 하우스 룰이 적용된다는 점을 기억하세요.
면책사항
해당 정보와 게시물은 금융, 투자, 트레이딩 또는 기타 유형의 조언이나 권장 사항으로 간주되지 않으며, 트레이딩뷰에서 제공하거나 보증하는 것이 아닙니다. 자세한 내용은 이용 약관을 참조하세요.
오픈 소스 스크립트
트레이딩뷰의 진정한 정신에 따라, 이 스크립트의 작성자는 이를 오픈소스로 공개하여 트레이더들이 기능을 검토하고 검증할 수 있도록 했습니다. 작성자에게 찬사를 보냅니다! 이 코드는 무료로 사용할 수 있지만, 코드를 재게시하는 경우 하우스 룰이 적용된다는 점을 기억하세요.
면책사항
해당 정보와 게시물은 금융, 투자, 트레이딩 또는 기타 유형의 조언이나 권장 사항으로 간주되지 않으며, 트레이딩뷰에서 제공하거나 보증하는 것이 아닙니다. 자세한 내용은 이용 약관을 참조하세요.