INVITE-ONLY SCRIPT
업데이트됨 Projected EMA based on past 21 days [UOI]
As we transition from a bear market to a more positive market sentiment, many equities are starting to rise above the 200-day Exponential Moving Average (EMA) and experience significant price increases solely based on this technical factor.
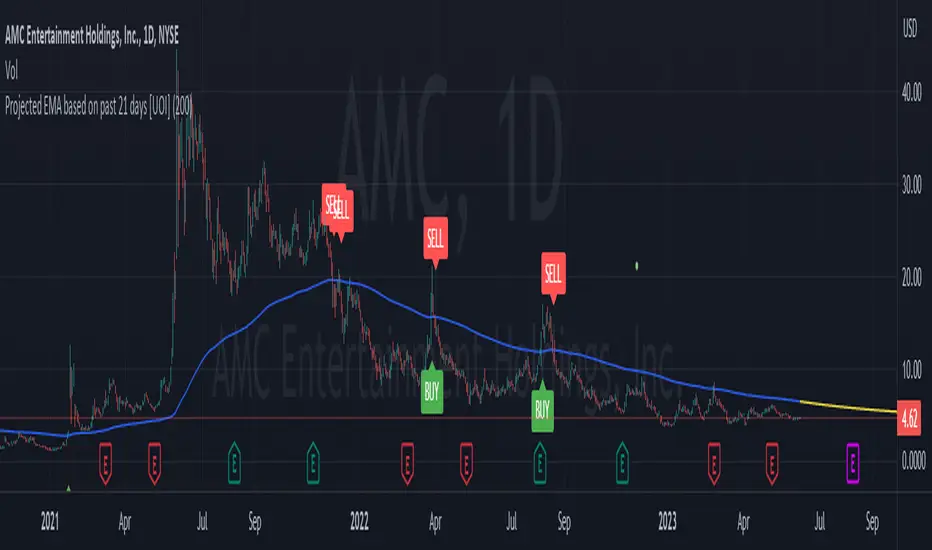
Here is a good example with AMC :
AMC :

This indicator is designed to help you predict the future crossover point by calculating the average price over the past 21 days and projecting the 200-day EMA for the future.
This indicator is tailored to assist average individuals who are interested in swing trading stocks or other securities. It enables them to anticipate when the price of a stock might move above or below a significant level known as the 200-day EMA, although it can be adjusted to different values like 100 or 50 EMA. When a stock price moves above the 200-day EMA, it is often considered a positive sign for future price increases.
Here is how this can help us understand the natural cycle of price action:

The indicator functions by calculating the average price over the past 200 days, which helps smooth out daily price fluctuations and provides a clearer perspective of the overall trend. It also considers the average price change over the previous 21 days to project future prices. By doing so, it aims to predict when the price might cross above the 200-day EMA line.
When utilizing this indicator, you will observe two lines on the price chart. The first line represents the 200-day EMA, visually depicting the average price trend. The second set of lines, displayed as dashed lines, indicate potential future price movements. These lines assist in anticipating when the price might surpass the 200-day EMA line, indicating a potential upcoming bullish (upward) trend.
To summarize, this indicator serves as a valuable tool for average individuals interested in trading securities. It facilitates the identification of critical points in stock prices, empowering users to make more informed decisions regarding when to buy or sell based on projected movements relative to the 200-day EMA line.
Here is a good example with
This indicator is designed to help you predict the future crossover point by calculating the average price over the past 21 days and projecting the 200-day EMA for the future.
This indicator is tailored to assist average individuals who are interested in swing trading stocks or other securities. It enables them to anticipate when the price of a stock might move above or below a significant level known as the 200-day EMA, although it can be adjusted to different values like 100 or 50 EMA. When a stock price moves above the 200-day EMA, it is often considered a positive sign for future price increases.
Here is how this can help us understand the natural cycle of price action:
The indicator functions by calculating the average price over the past 200 days, which helps smooth out daily price fluctuations and provides a clearer perspective of the overall trend. It also considers the average price change over the previous 21 days to project future prices. By doing so, it aims to predict when the price might cross above the 200-day EMA line.
When utilizing this indicator, you will observe two lines on the price chart. The first line represents the 200-day EMA, visually depicting the average price trend. The second set of lines, displayed as dashed lines, indicate potential future price movements. These lines assist in anticipating when the price might surpass the 200-day EMA line, indicating a potential upcoming bullish (upward) trend.
To summarize, this indicator serves as a valuable tool for average individuals interested in trading securities. It facilitates the identification of critical points in stock prices, empowering users to make more informed decisions regarding when to buy or sell based on projected movements relative to the 200-day EMA line.
릴리즈 노트
added buy sell signal with certain conditions. This is ideal for higher timeframe 릴리즈 노트
Updated buy sell signal to be off by default. users can turn them on릴리즈 노트
updated the length to past 21 days초대 전용 스크립트
이 스크립트는 작성자가 승인한 사용자만 접근할 수 있습니다. 사용하려면 요청 후 승인을 받아야 하며, 일반적으로 결제 후에 허가가 부여됩니다. 자세한 내용은 아래 작성자의 안내를 따르거나 uoi2020에게 직접 문의하세요.
트레이딩뷰는 스크립트의 작동 방식을 충분히 이해하고 작성자를 완전히 신뢰하지 않는 이상, 해당 스크립트에 비용을 지불하거나 사용하는 것을 권장하지 않습니다. 커뮤니티 스크립트에서 무료 오픈소스 대안을 찾아보실 수도 있습니다.
작성자 지시 사항
Request access via my Twitter subscriber/beta tester page: @userofintellect
면책사항
해당 정보와 게시물은 금융, 투자, 트레이딩 또는 기타 유형의 조언이나 권장 사항으로 간주되지 않으며, 트레이딩뷰에서 제공하거나 보증하는 것이 아닙니다. 자세한 내용은 이용 약관을 참조하세요.
초대 전용 스크립트
이 스크립트는 작성자가 승인한 사용자만 접근할 수 있습니다. 사용하려면 요청 후 승인을 받아야 하며, 일반적으로 결제 후에 허가가 부여됩니다. 자세한 내용은 아래 작성자의 안내를 따르거나 uoi2020에게 직접 문의하세요.
트레이딩뷰는 스크립트의 작동 방식을 충분히 이해하고 작성자를 완전히 신뢰하지 않는 이상, 해당 스크립트에 비용을 지불하거나 사용하는 것을 권장하지 않습니다. 커뮤니티 스크립트에서 무료 오픈소스 대안을 찾아보실 수도 있습니다.
작성자 지시 사항
Request access via my Twitter subscriber/beta tester page: @userofintellect
면책사항
해당 정보와 게시물은 금융, 투자, 트레이딩 또는 기타 유형의 조언이나 권장 사항으로 간주되지 않으며, 트레이딩뷰에서 제공하거나 보증하는 것이 아닙니다. 자세한 내용은 이용 약관을 참조하세요.