OPEN-SOURCE SCRIPT
Simple Risk-to-Reward (R) Indicator (TP1–TP2)

What this indicator does:
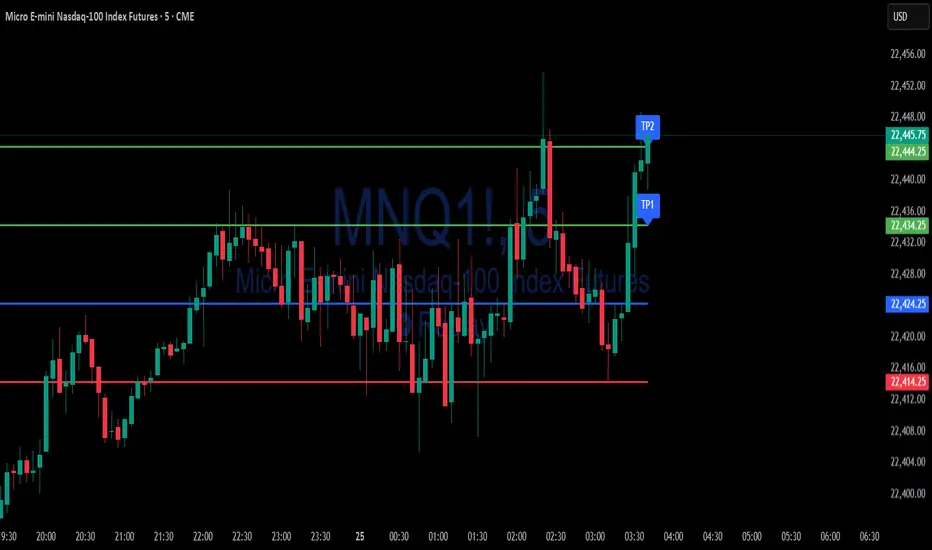
This tool helps traders clearly visualize their risk and reward on any trade by plotting their entry, stop loss, and take-profit (TP) levels directly on the chart. It’s designed to make manual trade planning more visual and systematic.
How it works:
How to use it:
What makes it unique and useful:
This indicator is designed for manual trade planning, giving you full control over your inputs and letting you instantly see your risk/reward on any instrument or timeframe. Unlike some built-in tools, it supports both long and short trades, lets you set all levels manually, and keeps your charts clean and easy to interpret.
This tool helps traders clearly visualize their risk and reward on any trade by plotting their entry, stop loss, and take-profit (TP) levels directly on the chart. It’s designed to make manual trade planning more visual and systematic.
How it works:
- You set your planned entry price, whether you want to plot a Long or Short setup, and your stop-loss distance (in ticks).
- The indicator calculates your stop-loss level and automatically plots it on the chart.
- It then draws take-profit levels at 1R and 2R (where “R” is your risk, the distance between entry and stop).
- You can toggle the TP1 and TP2 lines on or off to suit your preference.
How to use it:
- Open the settings and enter your intended entry price.
- Select “Long Setup” for a buy trade, or turn it off for a sell/short trade.
- Enter your desired stop loss in ticks.
- Choose which take-profit levels to display by toggling TP1 and TP2.
- The indicator will show entry, stop, and take-profit levels right on your chart so you can easily see your planned risk/reward.
What makes it unique and useful:
This indicator is designed for manual trade planning, giving you full control over your inputs and letting you instantly see your risk/reward on any instrument or timeframe. Unlike some built-in tools, it supports both long and short trades, lets you set all levels manually, and keeps your charts clean and easy to interpret.
오픈 소스 스크립트
트레이딩뷰의 진정한 정신에 따라, 이 스크립트의 작성자는 이를 오픈소스로 공개하여 트레이더들이 기능을 검토하고 검증할 수 있도록 했습니다. 작성자에게 찬사를 보냅니다! 이 코드는 무료로 사용할 수 있지만, 코드를 재게시하는 경우 하우스 룰이 적용된다는 점을 기억하세요.
Simple Indicators – Premium tools & more: simpleindicators.gumroad.com/
면책사항
해당 정보와 게시물은 금융, 투자, 트레이딩 또는 기타 유형의 조언이나 권장 사항으로 간주되지 않으며, 트레이딩뷰에서 제공하거나 보증하는 것이 아닙니다. 자세한 내용은 이용 약관을 참조하세요.