INVITE-ONLY SCRIPT
업데이트됨 Open Interest and Liquidity [by Alpha_Precision_Charts]
Indicator Description: Open Interest and Liquidity [by Alpha_Precision_Charts]
Introduction:
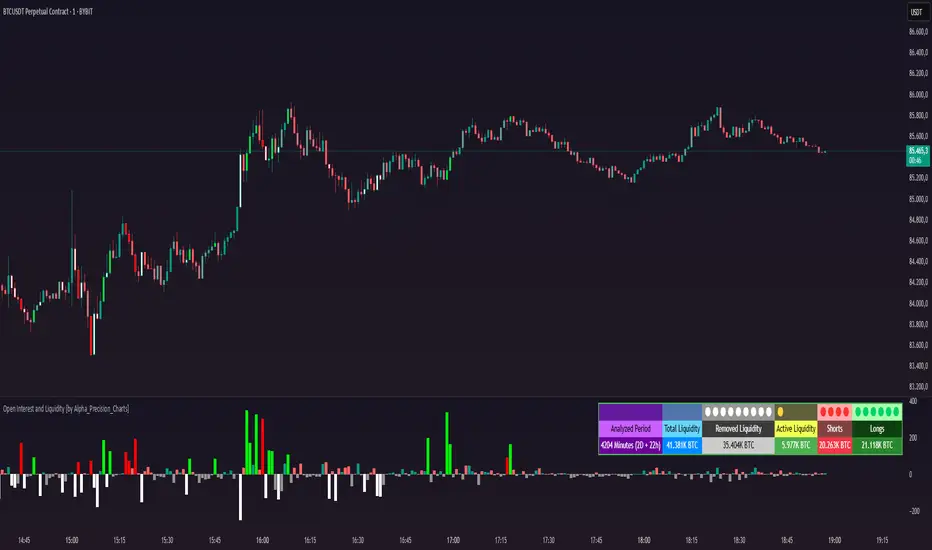
The "Open Interest and Liquidity" indicator is an advanced tool designed for traders seeking to analyze aggregated Open Interest (OI) flow and liquidity in the cryptocurrency market, with a special focus on Bitcoin. It combines high-quality Open Interest data, a detailed liquidity table, and a visual longs vs shorts gauge, providing a comprehensive real-time view of market dynamics. Ideal for scalpers, swing traders, and volume analysts, this indicator is highly customizable and optimized for 1-minute charts, though it works across other timeframes as well.
Key Features:
Aggregated Open Interest and Delta: Leverages Binance data for accuracy, allowing traders to switch between displaying absolute OI or OI Delta, with value conversion to base currency or USD.
Liquidity Table: Displays the analyzed period, active liquidity, shorts, and longs with visual proportion bars, functioning for various cryptocurrencies as long as Open Interest data is available.
Longs vs Shorts Gauge: A semicircle visual that shows real-time market sentiment, adjustable for chart positioning, helping identify imbalances, optimized and exclusive for Bitcoin on 1-minute charts.
Utilities:
Sentiment Analysis: Quickly detect whether the market is accumulating positions (longs/shorts) or liquidating (OI exits).
Pivot Identification: Highlight key moments of high buying or selling pressure, ideal for trade entries or exits.
Liquidity Monitoring: The table and gauge provide a clear view of active liquidity, helping assess a move’s strength.
Scalping and Day Trading: Perfect for short-term traders operating on 1-minute charts, offering fast and precise visual insights.
How to Use:
Initial Setup: Choose between "Open Interest" (candles) or "Open Interest Delta" (columns) in the "Display" field. The indicator defaults to Binance data for enhanced accuracy.
Customization: Enable/disable the table and gauge as needed and position them on the chart.
Interpretation: Combine OI Delta and gauge data with price movement to anticipate breakouts or reversals.
Technical Notes
The indicator uses a 500-period VWMA to calculate significant OI Delta thresholds and is optimized for Bitcoin (BTCUSDT.P) on high-liquidity charts.
Disclaimer
This indicator relies on the availability of Open Interest data on TradingView. For best results, use on Bitcoin charts with high liquidity, such as BTCUSDT.P. Accuracy may vary with lower-volume assets or exchanges.
Introduction:
The "Open Interest and Liquidity" indicator is an advanced tool designed for traders seeking to analyze aggregated Open Interest (OI) flow and liquidity in the cryptocurrency market, with a special focus on Bitcoin. It combines high-quality Open Interest data, a detailed liquidity table, and a visual longs vs shorts gauge, providing a comprehensive real-time view of market dynamics. Ideal for scalpers, swing traders, and volume analysts, this indicator is highly customizable and optimized for 1-minute charts, though it works across other timeframes as well.
Key Features:
Aggregated Open Interest and Delta: Leverages Binance data for accuracy, allowing traders to switch between displaying absolute OI or OI Delta, with value conversion to base currency or USD.
Liquidity Table: Displays the analyzed period, active liquidity, shorts, and longs with visual proportion bars, functioning for various cryptocurrencies as long as Open Interest data is available.
Longs vs Shorts Gauge: A semicircle visual that shows real-time market sentiment, adjustable for chart positioning, helping identify imbalances, optimized and exclusive for Bitcoin on 1-minute charts.
Utilities:
Sentiment Analysis: Quickly detect whether the market is accumulating positions (longs/shorts) or liquidating (OI exits).
Pivot Identification: Highlight key moments of high buying or selling pressure, ideal for trade entries or exits.
Liquidity Monitoring: The table and gauge provide a clear view of active liquidity, helping assess a move’s strength.
Scalping and Day Trading: Perfect for short-term traders operating on 1-minute charts, offering fast and precise visual insights.
How to Use:
Initial Setup: Choose between "Open Interest" (candles) or "Open Interest Delta" (columns) in the "Display" field. The indicator defaults to Binance data for enhanced accuracy.
Customization: Enable/disable the table and gauge as needed and position them on the chart.
Interpretation: Combine OI Delta and gauge data with price movement to anticipate breakouts or reversals.
Technical Notes
The indicator uses a 500-period VWMA to calculate significant OI Delta thresholds and is optimized for Bitcoin (BTCUSDT.P) on high-liquidity charts.
Disclaimer
This indicator relies on the availability of Open Interest data on TradingView. For best results, use on Bitcoin charts with high liquidity, such as BTCUSDT.P. Accuracy may vary with lower-volume assets or exchanges.
릴리즈 노트
Indicator Description: Open Interest and Liquidity [by Alpha_Precision_Charts]Introduction:
The "Open Interest and Liquidity" indicator is an advanced tool designed for traders seeking to analyze aggregated Open Interest (OI) flow and liquidity in the cryptocurrency market, with a special focus on Bitcoin. It combines high-quality Open Interest data, a detailed liquidity table, and a visual longs vs shorts gauge, providing a comprehensive real-time view of market dynamics. Ideal for scalpers, swing traders, and volume analysts, this indicator is highly customizable and optimized for 1-minute charts, though it works across other timeframes as well.
Key Features:
Aggregated Open Interest and Delta: Leverages Binance data for accuracy, allowing traders to switch between displaying absolute OI or OI Delta, with value conversion to base currency or USD.
Liquidity Table: Displays the analyzed period, active liquidity, shorts, and longs with visual proportion bars, functioning for various cryptocurrencies as long as Open Interest data is available.
Longs vs Shorts Gauge: A semicircle visual that shows real-time market sentiment, adjustable for chart positioning, helping identify imbalances, optimized and exclusive for Bitcoin on 1-minute charts.
Utilities:
Sentiment Analysis: Quickly detect whether the market is accumulating positions (longs/shorts) or liquidating (OI exits).
Pivot Identification: Highlight key moments of high buying or selling pressure, ideal for trade entries or exits.
Liquidity Monitoring: The table and gauge provide a clear view of active liquidity, helping assess a move’s strength.
Scalping and Day Trading: Perfect for short-term traders operating on 1-minute charts, offering fast and precise visual insights.
How to Use:
Initial Setup: Choose between "Open Interest" (candles) or "Open Interest Delta" (columns) in the "Display" field. The indicator defaults to Binance data for enhanced accuracy.
Customization: Enable/disable the table and gauge as needed and position them on the chart.
Interpretation: Combine OI Delta and gauge data with price movement to anticipate breakouts or reversals.
Technical Notes
The indicator uses a 500-period VWMA to calculate significant OI Delta thresholds and is optimized for Bitcoin (BTCUSDT.P) on high-liquidity charts.
Disclaimer
This indicator relies on the availability of Open Interest data on TradingView. For best results, use on Bitcoin charts with high liquidity, such as BTCUSDT.P. Accuracy may vary with lower-volume assets or exchanges.
초대 전용 스크립트
이 스크립트는 작성자가 승인한 사용자만 접근할 수 있습니다. 사용하려면 요청 후 승인을 받아야 하며, 일반적으로 결제 후에 허가가 부여됩니다. 자세한 내용은 아래 작성자의 안내를 따르거나 Alpha_Precision_Charts에게 직접 문의하세요.
트레이딩뷰는 스크립트의 작동 방식을 충분히 이해하고 작성자를 완전히 신뢰하지 않는 이상, 해당 스크립트에 비용을 지불하거나 사용하는 것을 권장하지 않습니다. 커뮤니티 스크립트에서 무료 오픈소스 대안을 찾아보실 수도 있습니다.
작성자 지시 사항
Access "Heatmap Longs/Shorts with OI Sensitivity & Aggregated Tools" requires a paid subscription. Contact us via TradingView private chat or email alpha.analytics2030@gmail.com for details.
면책사항
해당 정보와 게시물은 금융, 투자, 트레이딩 또는 기타 유형의 조언이나 권장 사항으로 간주되지 않으며, 트레이딩뷰에서 제공하거나 보증하는 것이 아닙니다. 자세한 내용은 이용 약관을 참조하세요.