OPEN-SOURCE SCRIPT
GP - Long Short Scanner
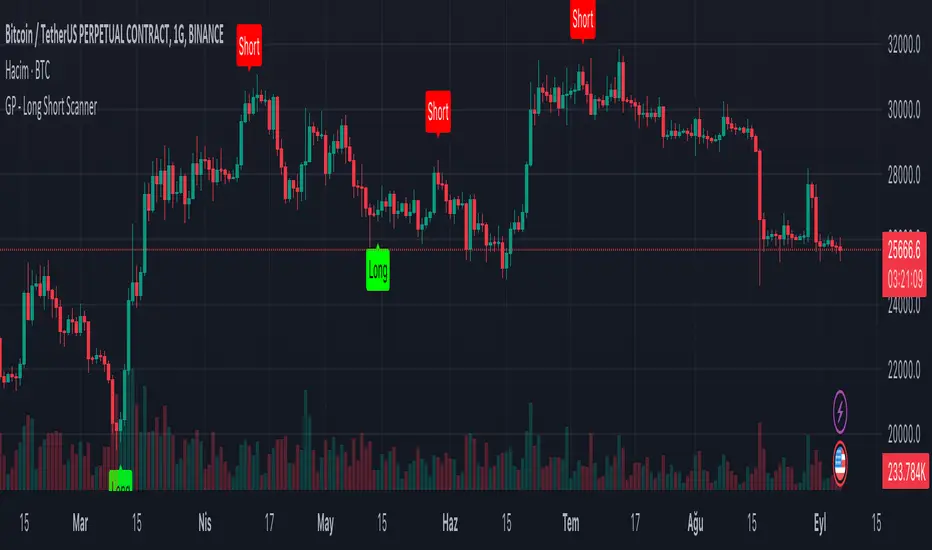
This script is made to predict the point at which price-time charts will rise or fall. The script was inspired by the RSI and TSI formulas. The formula is simply; Calculates the RSI and TSI values of open, high, low and close. Calculated values are converted to an array. The maximum and minimum values in the array are taken for the candles included in the calculation. These values calculate the time when the "Long" label will be seen on the chart of the candle that will increase the price. At the same time, it calculates the time when the "Short" label will appear on the chart of the candle that will decrease the price. Although these calculations are not precise; Seeing the “Long” label means that the price will rise at that candle, and seeing the “Short” label means that the price will decrease at that candle. The “Long”, “Short” tags from this script alone should not be used to determine the direction of the price. It can be used on all price-time charts.
오픈 소스 스크립트
트레이딩뷰의 진정한 정신에 따라, 이 스크립트의 작성자는 이를 오픈소스로 공개하여 트레이더들이 기능을 검토하고 검증할 수 있도록 했습니다. 작성자에게 찬사를 보냅니다! 이 코드는 무료로 사용할 수 있지만, 코드를 재게시하는 경우 하우스 룰이 적용된다는 점을 기억하세요.
면책사항
해당 정보와 게시물은 금융, 투자, 트레이딩 또는 기타 유형의 조언이나 권장 사항으로 간주되지 않으며, 트레이딩뷰에서 제공하거나 보증하는 것이 아닙니다. 자세한 내용은 이용 약관을 참조하세요.
오픈 소스 스크립트
트레이딩뷰의 진정한 정신에 따라, 이 스크립트의 작성자는 이를 오픈소스로 공개하여 트레이더들이 기능을 검토하고 검증할 수 있도록 했습니다. 작성자에게 찬사를 보냅니다! 이 코드는 무료로 사용할 수 있지만, 코드를 재게시하는 경우 하우스 룰이 적용된다는 점을 기억하세요.
면책사항
해당 정보와 게시물은 금융, 투자, 트레이딩 또는 기타 유형의 조언이나 권장 사항으로 간주되지 않으며, 트레이딩뷰에서 제공하거나 보증하는 것이 아닙니다. 자세한 내용은 이용 약관을 참조하세요.