INVITE-ONLY SCRIPT
Multi-Timeframe Close and Midpoint Confluence
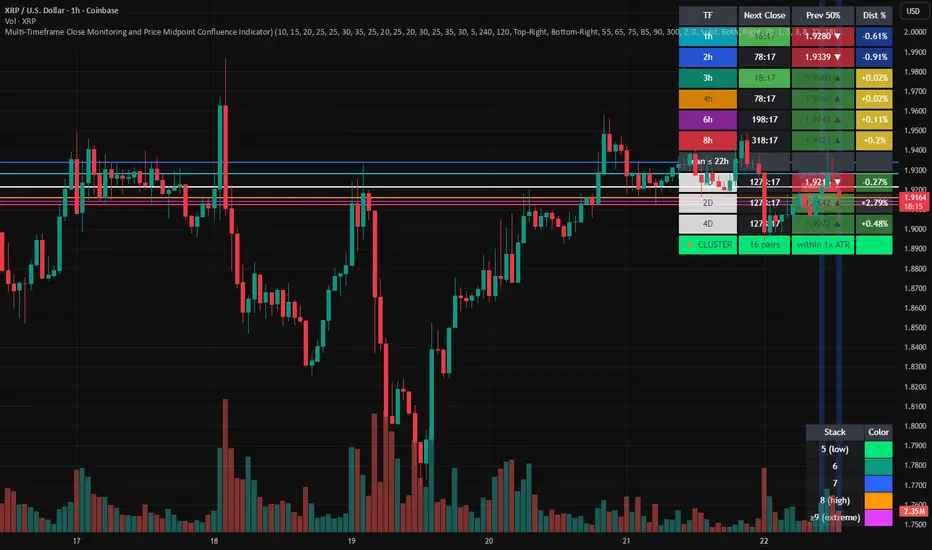
Multi-Timeframe Close Monitoring and Price Midpoint Confluence Indicator
This indicator is designed to assist traders in monitoring multiple timeframe candle closes and identifying areas where price midpoints (50% levels) from different timeframes cluster together.
The tool focuses on timing awareness and structural context, helping users observe periods where multiple timeframe events occur close together, which may coincide with increased market activity.
What the Indicator Tracks
The indicator monitors candle close timing and price context across multiple timeframes, including:
Intraday timeframe closes (30m, 1h, 2h, 3h, 4h, 6h, 8h)
Higher-timeframe closes (Daily, Weekly, Monthly) when within a defined scan window
The midpoint (50%) of the previous candle for each tracked timeframe
The distance between current price and each midpoint level
This information is evaluated independently for each timeframe.
Timeframe Close Confluence
When multiple timeframes are approaching a candle close within a short window, the indicator highlights this period visually.
These moments can be useful for observing potential shifts in activity or volatility, particularly when combined with other forms of analysis.
Visual markers and optional alerts are used to draw attention to these timing clusters.
Midpoint (50%) Level Clustering
The indicator also evaluates whether multiple 50% levels from different timeframes are located within a user-defined proximity.
When several midpoints cluster closely together, the area is highlighted as a zone of interest for further observation, as overlapping price references may act as areas of interaction.
Countdown & Information Panel
An optional on-chart panel displays:
A live countdown to upcoming timeframe closes
Relative urgency based on proximity to each close
Whether current price is above or below each midpoint
Distance metrics to help gauge proximity
Color coding is used to improve readability rather than indicate trade direction.
Visual Context Tools
Additional visual options include:
Background shading when multiple timing or midpoint conditions overlap
Adjustable thresholds to control sensitivity
Customizable colors, opacity, and panel placement
These visuals are intended to provide contextual awareness, not trade signals.
Intended Use
Style: Multi-timeframe analysis and timing awareness
Markets: Forex, crypto, equities, futures
Purpose:
Monitor upcoming timeframe closes
Observe overlapping price reference zones
Improve preparation around potential activity windows
The indicator is best used as a supplementary tool alongside independent analysis.
Important Notes
This script is provided for educational and analytical purposes only.
It does not predict market outcomes and should not be used as a standalone decision-making tool. Users are encouraged to apply appropriate risk controls and confirm observations with additional analysis.
초대 전용 스크립트
이 스크립트는 작성자가 승인한 사용자만 접근할 수 있습니다. 사용하려면 요청 후 승인을 받아야 하며, 일반적으로 결제 후에 허가가 부여됩니다. 자세한 내용은 아래 작성자의 안내를 따르거나 Marketscannerpros에게 직접 문의하세요.
트레이딩뷰는 스크립트의 작동 방식을 충분히 이해하고 작성자를 완전히 신뢰하지 않는 이상, 해당 스크립트에 비용을 지불하거나 사용하는 것을 권장하지 않습니다. 커뮤니티 스크립트에서 무료 오픈소스 대안을 찾아보실 수도 있습니다.
작성자 지시 사항
This script is invite-only. Please contact me via private message on TradingView to request access.
MarketScanner Pros is an all-in-one trading suite built by traders, for traders.
면책사항
해당 정보와 게시물은 금융, 투자, 트레이딩 또는 기타 유형의 조언이나 권장 사항으로 간주되지 않으며, 트레이딩뷰에서 제공하거나 보증하는 것이 아닙니다. 자세한 내용은 이용 약관을 참조하세요.