OPEN-SOURCE SCRIPT
EMA Price Range by tuanduong
EMA Price Range Indicator – Dynamic Range Analysis with Custom EMA (tuanduong2511)
Overview
The EMA Price Range Indicator is designed to help traders visualize the distance between price action and a key Exponential Moving Average (EMA). This indicator dynamically calculates the range from each candle to a user-defined EMA and displays it in a real-time table. By understanding the relationship between price and the EMA, traders can better gauge potential support, resistance, and overextension in the market.
Key Features
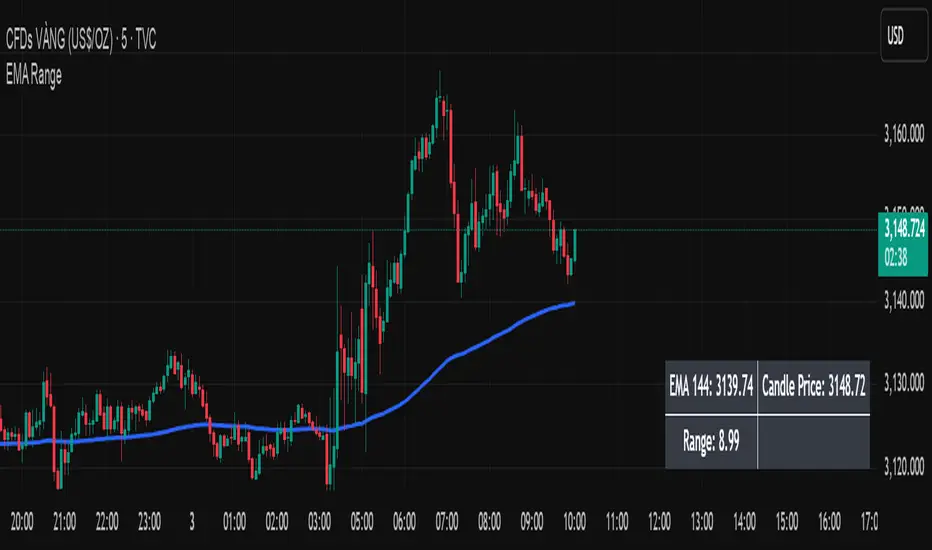
✅ Customizable EMA – Allows users to choose the EMA period that best suits their strategy (default: 144).
✅ Real-Time Range Calculation – Computes the absolute difference between the EMA and the price (using the high or low, depending on whether the candle is above or below the EMA).
✅ Minimalist UI – The EMA is plotted directly on the chart, while a small table in the bottom-right corner provides numerical insights, reducing chart clutter.
✅ Versatile Use Cases – Suitable for trend-following traders (identifying pullbacks to EMA) and mean-reversion traders (spotting extended price movements).
How It Works
User-Defined EMA:
The script calculates an Exponential Moving Average (EMA) based on the selected period.
EMA adapts dynamically, giving more weight to recent price movements.
Range Calculation:
If the price is above the EMA, the range is measured from the high point of the candle to the EMA.
If the price is below the EMA, the range is measured from the low point of the candle to the EMA.
This approach ensures that we’re measuring the most relevant distance for price interaction.
Live Table Display:
The current EMA value and the distance (range) from the price are displayed in a small table in the bottom-right corner of the chart.
How to Use It
📌 Trend Traders: Use the indicator to track pullbacks to key EMAs (e.g., EMA 50, 144, or 200). When the price is far from the EMA, it may indicate an overextended trend or potential retracement zone.
📌 Mean Reversion Traders: Look for extreme deviations between price and the EMA. Large distances can signal potential price snapbacks to the mean.
📌 Scalping & Day Trading: Short-term traders can use it with fast EMAs (e.g., EMA 21 or 34) to measure quick price movements relative to short-term momentum.
Why This Indicator?
Unlike traditional EMA indicators, which only plot a moving average, this script provides quantifiable price distance to the EMA, helping traders make data-driven decisions. It allows traders to answer:
✅ Is the price stretched too far from the EMA?
✅ Should I wait for a pullback before entering?
✅ Is the trend strong, or is the price losing momentum?
By integrating EMA-based range analysis, traders gain a clearer understanding of market conditions and can improve their entry, exit, and risk management strategies.
Overview
The EMA Price Range Indicator is designed to help traders visualize the distance between price action and a key Exponential Moving Average (EMA). This indicator dynamically calculates the range from each candle to a user-defined EMA and displays it in a real-time table. By understanding the relationship between price and the EMA, traders can better gauge potential support, resistance, and overextension in the market.
Key Features
✅ Customizable EMA – Allows users to choose the EMA period that best suits their strategy (default: 144).
✅ Real-Time Range Calculation – Computes the absolute difference between the EMA and the price (using the high or low, depending on whether the candle is above or below the EMA).
✅ Minimalist UI – The EMA is plotted directly on the chart, while a small table in the bottom-right corner provides numerical insights, reducing chart clutter.
✅ Versatile Use Cases – Suitable for trend-following traders (identifying pullbacks to EMA) and mean-reversion traders (spotting extended price movements).
How It Works
User-Defined EMA:
The script calculates an Exponential Moving Average (EMA) based on the selected period.
EMA adapts dynamically, giving more weight to recent price movements.
Range Calculation:
If the price is above the EMA, the range is measured from the high point of the candle to the EMA.
If the price is below the EMA, the range is measured from the low point of the candle to the EMA.
This approach ensures that we’re measuring the most relevant distance for price interaction.
Live Table Display:
The current EMA value and the distance (range) from the price are displayed in a small table in the bottom-right corner of the chart.
How to Use It
📌 Trend Traders: Use the indicator to track pullbacks to key EMAs (e.g., EMA 50, 144, or 200). When the price is far from the EMA, it may indicate an overextended trend or potential retracement zone.
📌 Mean Reversion Traders: Look for extreme deviations between price and the EMA. Large distances can signal potential price snapbacks to the mean.
📌 Scalping & Day Trading: Short-term traders can use it with fast EMAs (e.g., EMA 21 or 34) to measure quick price movements relative to short-term momentum.
Why This Indicator?
Unlike traditional EMA indicators, which only plot a moving average, this script provides quantifiable price distance to the EMA, helping traders make data-driven decisions. It allows traders to answer:
✅ Is the price stretched too far from the EMA?
✅ Should I wait for a pullback before entering?
✅ Is the trend strong, or is the price losing momentum?
By integrating EMA-based range analysis, traders gain a clearer understanding of market conditions and can improve their entry, exit, and risk management strategies.
오픈 소스 스크립트
트레이딩뷰의 진정한 정신에 따라, 이 스크립트의 작성자는 이를 오픈소스로 공개하여 트레이더들이 기능을 검토하고 검증할 수 있도록 했습니다. 작성자에게 찬사를 보냅니다! 이 코드는 무료로 사용할 수 있지만, 코드를 재게시하는 경우 하우스 룰이 적용된다는 점을 기억하세요.
면책사항
해당 정보와 게시물은 금융, 투자, 트레이딩 또는 기타 유형의 조언이나 권장 사항으로 간주되지 않으며, 트레이딩뷰에서 제공하거나 보증하는 것이 아닙니다. 자세한 내용은 이용 약관을 참조하세요.
오픈 소스 스크립트
트레이딩뷰의 진정한 정신에 따라, 이 스크립트의 작성자는 이를 오픈소스로 공개하여 트레이더들이 기능을 검토하고 검증할 수 있도록 했습니다. 작성자에게 찬사를 보냅니다! 이 코드는 무료로 사용할 수 있지만, 코드를 재게시하는 경우 하우스 룰이 적용된다는 점을 기억하세요.
면책사항
해당 정보와 게시물은 금융, 투자, 트레이딩 또는 기타 유형의 조언이나 권장 사항으로 간주되지 않으며, 트레이딩뷰에서 제공하거나 보증하는 것이 아닙니다. 자세한 내용은 이용 약관을 참조하세요.