OPEN-SOURCE SCRIPT
Prometheus Trend Lines
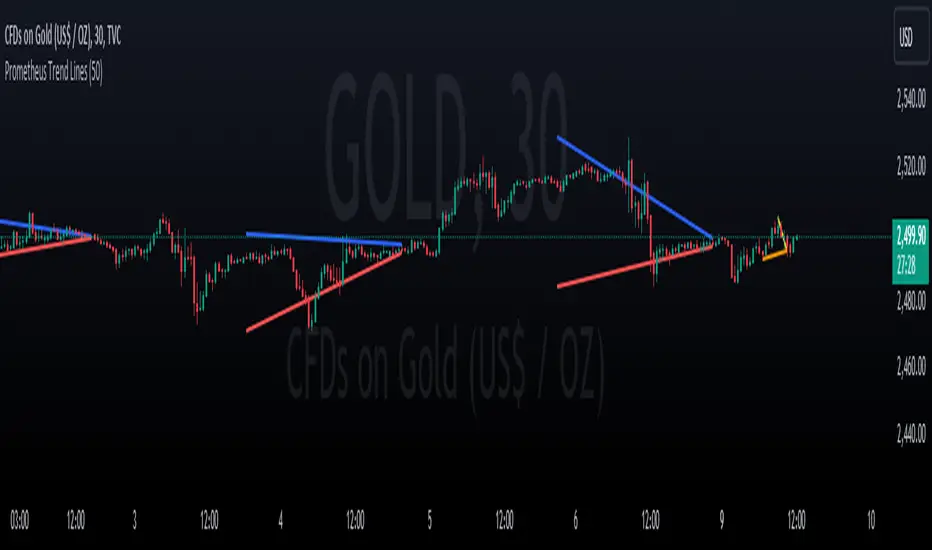
Prometheus Trend lines is a tool that automatically plots support and resistance trend lines on your chart. These lines generally come out looking like triangles or wedges.
There are two ways that we do it, the first way we’ll cover is lookback period generated trend lines.
The two points for the lines are generated as follows, for a resistance line that is blue by default, the point furthest in the past is the highest high in the specified lookback period. 50 is the default, the point closest to the present is the current bar’s high. The opposite is true for support lines, the point furthest in the past is the lowest low, and the most present point is the current bar’s low.
The interval is created by ensuring after the lookback period is met to plot the lines, that period needs to pass again. That is so we can let the potential results of price breaking above or below the levels play out.
Lines will be plotted on the newest lookback period bar, after a period with no plot. What I mean is right after lines are plotted, users will have to wait for double the lookback period to get newer lines. So if you select 50 for your lookback value, after new lines are plotted, on the 100th bar after the new lines will be there. This is to avoid having a line on your chart change, we’d rather plot a line once, than plot it and keep changing it.

Each line is 50 bars long and all the distance in between them is 50 bars. The line is drawn simply with the shortest path from the back point to the more present one, this allows us to see breaks in the line and get a better idea of how strong the next move may be.

We see in this wedge on TSLA that there were two false breaks before the price re-entered the wedge and continued falling. It could be interpreted as buyers did not have enough strength to get TSLA out of a downtrend there.
We also offer an intra day line.

In this image captured with the bar replay feature we see the lines being generated with the high and low of the day, that is the method we use. Furthermore, a user may notice that the ends of the line are not at the newest bar. That is on purpose, we use the
Pine Script®
to ensure that we don’t change and plot too many lines at a given point. These two lines will reset every day as time changes and will auto use the current day high and low.
Users have the option to select a custom lookback period, as well as turn on or off the plots for either method of generating lines.
We encourage traders to not follow indicators blindly, none are 100% accurate. The lines generated are not guaranteed to be perfect support and resistance levels. We encourage the use of discretion. Please comment on any desired updates, all criticism is welcome!
There are two ways that we do it, the first way we’ll cover is lookback period generated trend lines.
The two points for the lines are generated as follows, for a resistance line that is blue by default, the point furthest in the past is the highest high in the specified lookback period. 50 is the default, the point closest to the present is the current bar’s high. The opposite is true for support lines, the point furthest in the past is the lowest low, and the most present point is the current bar’s low.
The interval is created by ensuring after the lookback period is met to plot the lines, that period needs to pass again. That is so we can let the potential results of price breaking above or below the levels play out.
Lines will be plotted on the newest lookback period bar, after a period with no plot. What I mean is right after lines are plotted, users will have to wait for double the lookback period to get newer lines. So if you select 50 for your lookback value, after new lines are plotted, on the 100th bar after the new lines will be there. This is to avoid having a line on your chart change, we’d rather plot a line once, than plot it and keep changing it.
Each line is 50 bars long and all the distance in between them is 50 bars. The line is drawn simply with the shortest path from the back point to the more present one, this allows us to see breaks in the line and get a better idea of how strong the next move may be.
We see in this wedge on
We also offer an intra day line.
In this image captured with the bar replay feature we see the lines being generated with the high and low of the day, that is the method we use. Furthermore, a user may notice that the ends of the line are not at the newest bar. That is on purpose, we use the
barstate.islastconfirmedhistory
to ensure that we don’t change and plot too many lines at a given point. These two lines will reset every day as time changes and will auto use the current day high and low.
Users have the option to select a custom lookback period, as well as turn on or off the plots for either method of generating lines.
We encourage traders to not follow indicators blindly, none are 100% accurate. The lines generated are not guaranteed to be perfect support and resistance levels. We encourage the use of discretion. Please comment on any desired updates, all criticism is welcome!
오픈 소스 스크립트
트레이딩뷰의 진정한 정신에 따라, 이 스크립트의 작성자는 이를 오픈소스로 공개하여 트레이더들이 기능을 검토하고 검증할 수 있도록 했습니다. 작성자에게 찬사를 보냅니다! 이 코드는 무료로 사용할 수 있지만, 코드를 재게시하는 경우 하우스 룰이 적용된다는 점을 기억하세요.
면책사항
해당 정보와 게시물은 금융, 투자, 트레이딩 또는 기타 유형의 조언이나 권장 사항으로 간주되지 않으며, 트레이딩뷰에서 제공하거나 보증하는 것이 아닙니다. 자세한 내용은 이용 약관을 참조하세요.
오픈 소스 스크립트
트레이딩뷰의 진정한 정신에 따라, 이 스크립트의 작성자는 이를 오픈소스로 공개하여 트레이더들이 기능을 검토하고 검증할 수 있도록 했습니다. 작성자에게 찬사를 보냅니다! 이 코드는 무료로 사용할 수 있지만, 코드를 재게시하는 경우 하우스 룰이 적용된다는 점을 기억하세요.
면책사항
해당 정보와 게시물은 금융, 투자, 트레이딩 또는 기타 유형의 조언이나 권장 사항으로 간주되지 않으며, 트레이딩뷰에서 제공하거나 보증하는 것이 아닙니다. 자세한 내용은 이용 약관을 참조하세요.