OPEN-SOURCE SCRIPT
EMA Cross Counter
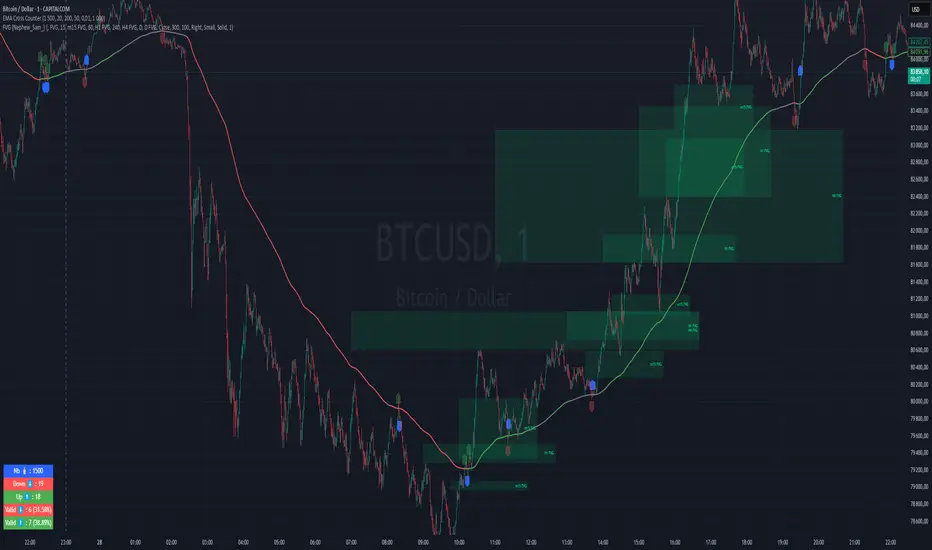
EMA Cross Counter – Trend & Crossover Analyzer
🔥 Description
The EMA Cross Counter is an advanced indicator designed to detect price crossovers with the EMA 200 and provide insightful trend analysis. It highlights valid signals and displays success statistics directly on the chart.
🎯 Key Features
✅ Crossover Detection: Identifies moments when the price crosses the EMA 200 upward or downward.
✅ Signal Filtering: Valid signals (leading to sustained trends) are shown in blue, while invalid signals are faded.
✅ Performance Analysis: A statistics table shows the number of crossovers and their success rate.
✅ Dynamic EMA Coloring:
🟢 Green when the trend is bullish
🔴 Red when the trend is bearish
⚪ Gray when the market is in a range
✅ Range Detection: If the price remains within a narrow range for 30 candles, the EMA turns gray to indicate trend uncertainty.
✅ Stop-Loss (SL) Display: A dashed red line appears below sell signals and above buy signals (adjustable in pips).
✅ Automatic Alerts: Get notified when a significant crossover occurs.
📈 How to Use It?
1️⃣ Look for blue signals as potential trade entries.
2️⃣ Avoid trading when the EMA is gray (ranging market).
3️⃣ Use success rate statistics to evaluate crossover reliability.
4️⃣ Adjust SL distance in the settings to match your risk management strategy.
🛠 Customization Options
Adjustable EMA period
Configurable range threshold
SL distance customizable in pips
Enable/Disable alerts
💡 Ideal for scalping and swing trading, this indicator offers clear trend insights to enhance your decision-making process!
💬 Try it out and share your feedback! 🚀
오픈 소스 스크립트
트레이딩뷰의 진정한 정신에 따라, 이 스크립트의 작성자는 이를 오픈소스로 공개하여 트레이더들이 기능을 검토하고 검증할 수 있도록 했습니다. 작성자에게 찬사를 보냅니다! 이 코드는 무료로 사용할 수 있지만, 코드를 재게시하는 경우 하우스 룰이 적용된다는 점을 기억하세요.
면책사항
해당 정보와 게시물은 금융, 투자, 트레이딩 또는 기타 유형의 조언이나 권장 사항으로 간주되지 않으며, 트레이딩뷰에서 제공하거나 보증하는 것이 아닙니다. 자세한 내용은 이용 약관을 참조하세요.
오픈 소스 스크립트
트레이딩뷰의 진정한 정신에 따라, 이 스크립트의 작성자는 이를 오픈소스로 공개하여 트레이더들이 기능을 검토하고 검증할 수 있도록 했습니다. 작성자에게 찬사를 보냅니다! 이 코드는 무료로 사용할 수 있지만, 코드를 재게시하는 경우 하우스 룰이 적용된다는 점을 기억하세요.
면책사항
해당 정보와 게시물은 금융, 투자, 트레이딩 또는 기타 유형의 조언이나 권장 사항으로 간주되지 않으며, 트레이딩뷰에서 제공하거나 보증하는 것이 아닙니다. 자세한 내용은 이용 약관을 참조하세요.