OPEN-SOURCE SCRIPT
업데이트됨 O'Neil Earnings Stability
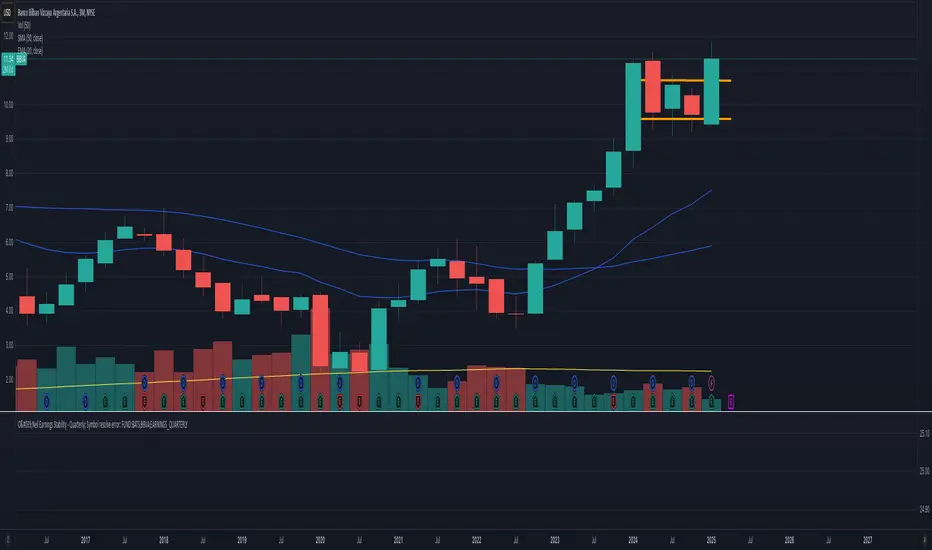
O'Neil Earnings Stability Indicator
This indicator implements William O'Neil's earnings stability analysis, a key factor in identifying high-quality growth stocks. It measures both earnings stability (1-99 scale) and growth rate.
Scale Interpretation:
• 1-25: Highly stable earnings (ideal)
• 26-30: Moderately stable
• >30: More cyclical/less dependable
The stability score is calculated by measuring deviations from the earnings trend line, with lower scores indicating more consistent growth. Combined with the annual growth rate (target ≥25%), this helps identify stocks with both steady and strong earnings growth.
Optimal Criteria:
✓ Stability Score < 25
✓ Annual Growth > 25%
This tool helps filter out stocks with erratic earnings patterns and identify those with proven, sustainable growth records. Green label indicates both criteria are met; red indicates one or both criteria failed."
Would you like me to modify any part of this description or add more details about specific aspects of the calculation?
The key concepts in these calculations:
Stability Score (1-99 scale):
Lower score = more stable
Takes average deviation from mean earnings
Uses logarithmic scaling to emphasize smaller deviations
Multiplies by 20 to get into 1-99 range
Score ≤ 25 meets O'Neil's criteria
Growth Rate:
Year-over-year comparison (current quarter vs same quarter last year)
Calculated as percentage change
Growth ≥ 25% meets O'Neil's criteria
O'Neil's Combined Criteria:
Stability Score should be ≤ 25 (indicating stable earnings)
Growth Rate should be ≥ 25% (indicating strong growth)
Both must be met for ideal conditions
릴리즈 노트
- updating script to stay static with earnings calculations not based on intervals selected오픈 소스 스크립트
트레이딩뷰의 진정한 정신에 따라, 이 스크립트의 작성자는 이를 오픈소스로 공개하여 트레이더들이 기능을 검토하고 검증할 수 있도록 했습니다. 작성자에게 찬사를 보냅니다! 이 코드는 무료로 사용할 수 있지만, 코드를 재게시하는 경우 하우스 룰이 적용된다는 점을 기억하세요.
면책사항
해당 정보와 게시물은 금융, 투자, 트레이딩 또는 기타 유형의 조언이나 권장 사항으로 간주되지 않으며, 트레이딩뷰에서 제공하거나 보증하는 것이 아닙니다. 자세한 내용은 이용 약관을 참조하세요.
오픈 소스 스크립트
트레이딩뷰의 진정한 정신에 따라, 이 스크립트의 작성자는 이를 오픈소스로 공개하여 트레이더들이 기능을 검토하고 검증할 수 있도록 했습니다. 작성자에게 찬사를 보냅니다! 이 코드는 무료로 사용할 수 있지만, 코드를 재게시하는 경우 하우스 룰이 적용된다는 점을 기억하세요.
면책사항
해당 정보와 게시물은 금융, 투자, 트레이딩 또는 기타 유형의 조언이나 권장 사항으로 간주되지 않으며, 트레이딩뷰에서 제공하거나 보증하는 것이 아닙니다. 자세한 내용은 이용 약관을 참조하세요.