OPEN-SOURCE SCRIPT
Volume Buy/Sell Chart
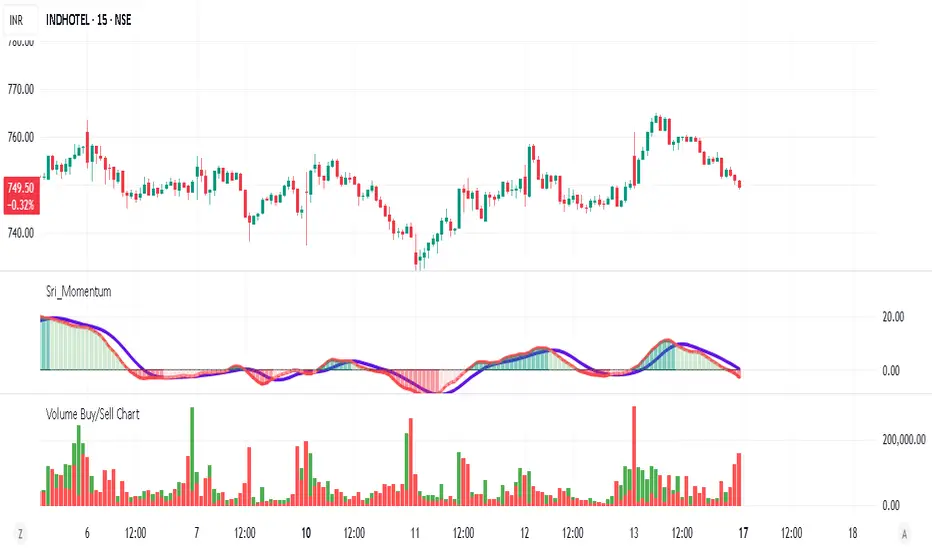
Volume Buy/Sell Chart
This script visualizes the distribution of buying and selling volume within each candlestick, helping traders identify dominant market pressure at a glance. It separates volume into Buy Volume (Green) and Sell Volume (Red) using a unique calculation based on price movement within a candle.
Features:
✅ Customizable Bar Display: Choose to display 5, 10, or 100 bars using a simple dropdown selection.
✅ Buy & Sell Volume Calculation: The script determines buying and selling volume dynamically based on price action within the candle.
✅ Custom Volume Threshold for Alerts: Set a percentage threshold (0–100) to trigger alerts when buy or sell volume exceeds a predefined level.
✅ Color-Coded Histogram:
Green Bars: Represent the estimated buy volume.
Red Bars: Represent the estimated sell volume.
✅ Alerts Integration: Automatically detect strong buy or sell signals when the respective volume percentage exceeds your set threshold.
How It Works:
The script calculates total price movement within a candle.
It then estimates buying and selling volume ratios based on whether the price closes higher or lower than it opened.
Finally, it normalizes the buy/sell volume against the total volume and plots it as a column chart.
Usage Guide:
Add the script to your chart.
Select how many bars to display (5, 10, or 100).
Adjust the Custom Volume Percentage Threshold (default: 75%).
Watch for significant buy/sell volume imbalances that might indicate market turning points!
This tool is great for traders looking to analyze volume flow and market sentiment with a simple yet effective visualization. 🚀
오픈 소스 스크립트
트레이딩뷰의 진정한 정신에 따라, 이 스크립트의 작성자는 이를 오픈소스로 공개하여 트레이더들이 기능을 검토하고 검증할 수 있도록 했습니다. 작성자에게 찬사를 보냅니다! 이 코드는 무료로 사용할 수 있지만, 코드를 재게시하는 경우 하우스 룰이 적용된다는 점을 기억하세요.
면책사항
해당 정보와 게시물은 금융, 투자, 트레이딩 또는 기타 유형의 조언이나 권장 사항으로 간주되지 않으며, 트레이딩뷰에서 제공하거나 보증하는 것이 아닙니다. 자세한 내용은 이용 약관을 참조하세요.
오픈 소스 스크립트
트레이딩뷰의 진정한 정신에 따라, 이 스크립트의 작성자는 이를 오픈소스로 공개하여 트레이더들이 기능을 검토하고 검증할 수 있도록 했습니다. 작성자에게 찬사를 보냅니다! 이 코드는 무료로 사용할 수 있지만, 코드를 재게시하는 경우 하우스 룰이 적용된다는 점을 기억하세요.
면책사항
해당 정보와 게시물은 금융, 투자, 트레이딩 또는 기타 유형의 조언이나 권장 사항으로 간주되지 않으며, 트레이딩뷰에서 제공하거나 보증하는 것이 아닙니다. 자세한 내용은 이용 약관을 참조하세요.