INVITE-ONLY SCRIPT
Unusual Market Volume Detector
Introduction
Price usually moves in lockstep with the volume trends i.e. price goes higher when there is buying and it goes down when there is selling in the market. But sometimes, the market behaves unusually i.e. Price and volume move in opposite directions. This indicator identifies precisely this divergent behavior in the market!
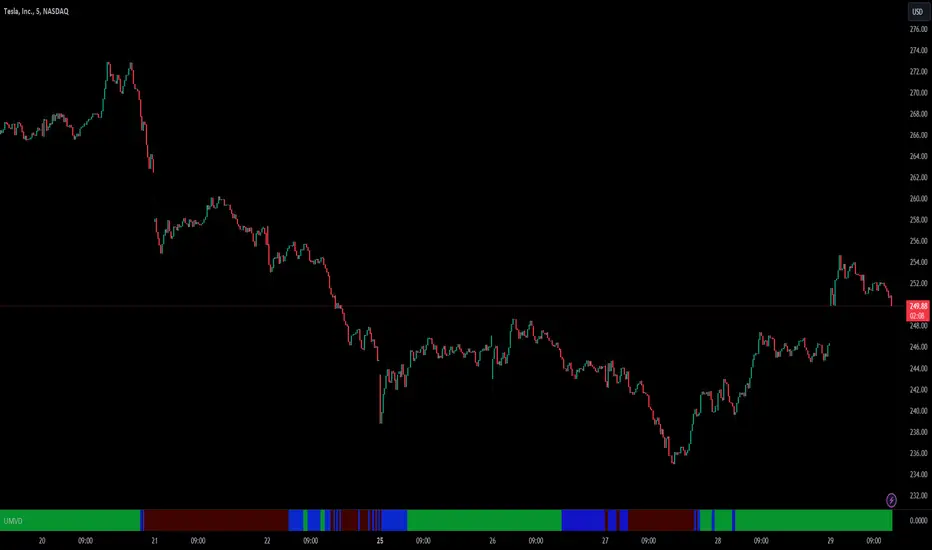
This script analyses the volume trends by utilizing changes in On Balance Volume (OBV) for the instrument and compares it with the price trend to color the lower panel on your chart window. The color changes as the direction of the OBV trend changes from Up to Down or vice versa. If there is a divergence between the price trend and volume trend, the color will switch to Purple.
Divergence in volume and price trends typically indicate a battle between supply and demand. This may coincide with a change in market direction as well. It is important to know which side won after this battle, as the market will follow that side.
This tool will alert traders of unusual market volume behavior and when both price & volume trends are in sync.
Features
How to use the Indicator while Trading?
Basic Set-Up
Please note: On-Balance Volume is a leading indicator but it doesn't provide specific information on exactly what happened or why. Also, a large spike in a single day may throw off the On Balance Volume for a while. Therefore we are focusing on its trend and comparing it with Price Trends for better effectiveness.
Price usually moves in lockstep with the volume trends i.e. price goes higher when there is buying and it goes down when there is selling in the market. But sometimes, the market behaves unusually i.e. Price and volume move in opposite directions. This indicator identifies precisely this divergent behavior in the market!
This script analyses the volume trends by utilizing changes in On Balance Volume (OBV) for the instrument and compares it with the price trend to color the lower panel on your chart window. The color changes as the direction of the OBV trend changes from Up to Down or vice versa. If there is a divergence between the price trend and volume trend, the color will switch to Purple.
Divergence in volume and price trends typically indicate a battle between supply and demand. This may coincide with a change in market direction as well. It is important to know which side won after this battle, as the market will follow that side.
This tool will alert traders of unusual market volume behavior and when both price & volume trends are in sync.
Features
- A Purple color in the lower panel indicates that the Volume and Price trends are diverging and are moving in the opposite direction
- A Green color in the lower panel indicates that the Volume is trending higher supporting bullish price action
- A Red color in the lower panel indicates that the Volume is trending lower supporting bearish price action
How to use the Indicator while Trading?
- When the Volume trend matches the price action (Trend), you have confirmation of your trade bias. Therefore when you are taking Long trades, you would want to see a Green color in the lower panel and a Red color when you are going Short.
- When a Divergence is identified by the tool, as Purple color in the lower panel, Trader can take the following steps:
- Take profit or partially close the position if you are in a Trade as this divergence presents
uncertainty
- Watch for which color comes up after divergence, that side of the market has a higher
probability of prevailing. For example, a Red color indicates Selling in the market and vice
versa.
- Divergence usually precedes a market direction change and therefore Trader can take this
into account when planning Trade bias and position size. Please note a divergence does
not always precede a reversal in the market and can be a temporary phenomenon with no
effect on the price action.
Basic Set-Up
- Add the Indicator to the chart
- You can change the default colors for Buying Volume, Selling Volume, and Divergence
- Use the “Regular Trading Hours” Session in the Chart Settings for the most effective analysis
Please note: On-Balance Volume is a leading indicator but it doesn't provide specific information on exactly what happened or why. Also, a large spike in a single day may throw off the On Balance Volume for a while. Therefore we are focusing on its trend and comparing it with Price Trends for better effectiveness.
초대 전용 스크립트
이 스크립트는 작성자가 승인한 사용자만 접근할 수 있습니다. 사용하려면 요청 후 승인을 받아야 하며, 일반적으로 결제 후에 허가가 부여됩니다. 자세한 내용은 아래 작성자의 안내를 따르거나 SnowflakeTrader에게 직접 문의하세요.
트레이딩뷰는 스크립트의 작동 방식을 충분히 이해하고 작성자를 완전히 신뢰하지 않는 이상, 해당 스크립트에 비용을 지불하거나 사용하는 것을 권장하지 않습니다. 커뮤니티 스크립트에서 무료 오픈소스 대안을 찾아보실 수도 있습니다.
작성자 지시 사항
Go To https://www.snowflaketrader.com/trader-resources to get access to this Indicator.
Visit snowflaketrader.com to get access to Free & Premium resources for Traders
Email : support@snowflaketrader.com
WhatsApp (Messages Only) : +1 341 345 8266
Discord : snowflaketrader
Email : support@snowflaketrader.com
WhatsApp (Messages Only) : +1 341 345 8266
Discord : snowflaketrader
면책사항
해당 정보와 게시물은 금융, 투자, 트레이딩 또는 기타 유형의 조언이나 권장 사항으로 간주되지 않으며, 트레이딩뷰에서 제공하거나 보증하는 것이 아닙니다. 자세한 내용은 이용 약관을 참조하세요.