PROTECTED SOURCE SCRIPT
ATR - FS
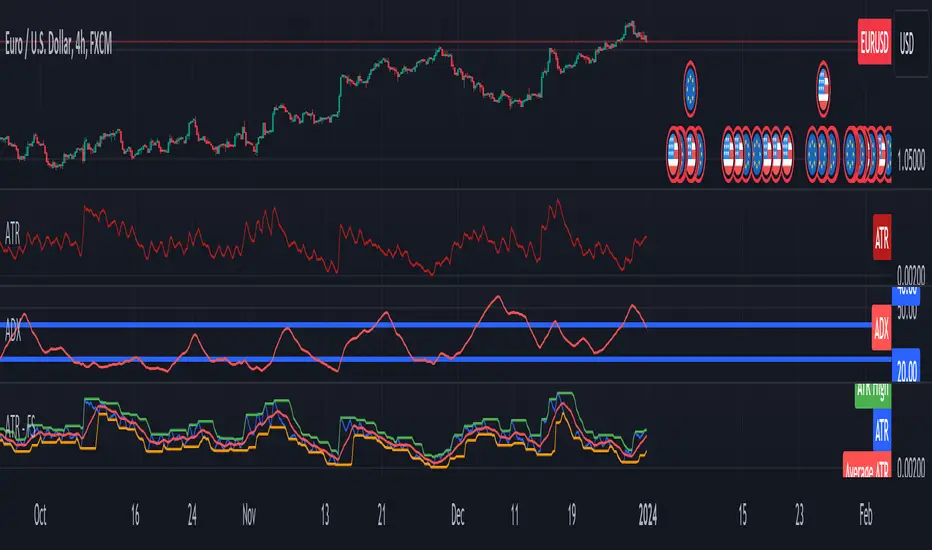
This script calculates and visualizes the Average True Range (ATR) along with its moving average, highest, and lowest values over a defined period. The ATR is a widely used volatility indicator in trading that measures the degree of price movement within a market. By incorporating both the average ATR and the high/low ranges, this script provides a comprehensive view of market volatility dynamics.
Use Cases:
Volatility-Based Trading:
Traders can use this indicator to gauge market volatility and adjust their trading strategies accordingly. For example:
During high volatility periods (high ATR values), traders might widen their stop-loss levels to accommodate larger price swings.
Conversely, during low volatility periods, traders may tighten their stop-loss levels to capture profits before the market moves against them.
Trend Identification:
The moving average of ATR helps traders identify long-term volatility trends, which can indicate the strength of a market trend:
Volatility Breakouts:
By analyzing the highest and lowest ATR values, traders can spot potential breakout opportunities:
Risk Management:
The ATR is a critical tool in risk management, helping traders set stop-losses and position sizes based on market conditions:
Use Cases:
Volatility-Based Trading:
Traders can use this indicator to gauge market volatility and adjust their trading strategies accordingly. For example:
- High ATR values often indicate periods of high volatility, suggesting larger price swings and more aggressive trading opportunities.
- Low ATR values signal quieter market conditions, where range-bound trading or less aggressive positioning might be favorable.
- Stop-Loss & Take-Profit Placement:
- The ATR is commonly used to determine optimal stop-loss and take-profit levels:
During high volatility periods (high ATR values), traders might widen their stop-loss levels to accommodate larger price swings.
Conversely, during low volatility periods, traders may tighten their stop-loss levels to capture profits before the market moves against them.
Trend Identification:
The moving average of ATR helps traders identify long-term volatility trends, which can indicate the strength of a market trend:
- If the average ATR is increasing, it could suggest the continuation of a strong trend.
- A decreasing average ATR may indicate the start of a consolidation period or weakening trend.
Volatility Breakouts:
By analyzing the highest and lowest ATR values, traders can spot potential breakout opportunities:
- A sudden spike in ATR (breaking above the green line) can indicate a breakout from a consolidation phase.
- Dropping below the orange line may signal a period of market stagnation or consolidation.
Risk Management:
The ATR is a critical tool in risk management, helping traders set stop-losses and position sizes based on market conditions:
- Higher ATR values might prompt a trader to reduce their position size to account for larger potential losses.
- Lower ATR values may encourage a trader to take on larger positions, as the market risk is lower.
보호된 스크립트입니다
이 스크립트는 비공개 소스로 게시됩니다. 하지만 이를 자유롭게 제한 없이 사용할 수 있습니다 – 자세한 내용은 여기에서 확인하세요.
면책사항
해당 정보와 게시물은 금융, 투자, 트레이딩 또는 기타 유형의 조언이나 권장 사항으로 간주되지 않으며, 트레이딩뷰에서 제공하거나 보증하는 것이 아닙니다. 자세한 내용은 이용 약관을 참조하세요.
보호된 스크립트입니다
이 스크립트는 비공개 소스로 게시됩니다. 하지만 이를 자유롭게 제한 없이 사용할 수 있습니다 – 자세한 내용은 여기에서 확인하세요.
면책사항
해당 정보와 게시물은 금융, 투자, 트레이딩 또는 기타 유형의 조언이나 권장 사항으로 간주되지 않으며, 트레이딩뷰에서 제공하거나 보증하는 것이 아닙니다. 자세한 내용은 이용 약관을 참조하세요.