OPEN-SOURCE SCRIPT
HTF Candle Support & Resistance «NoaTrader»
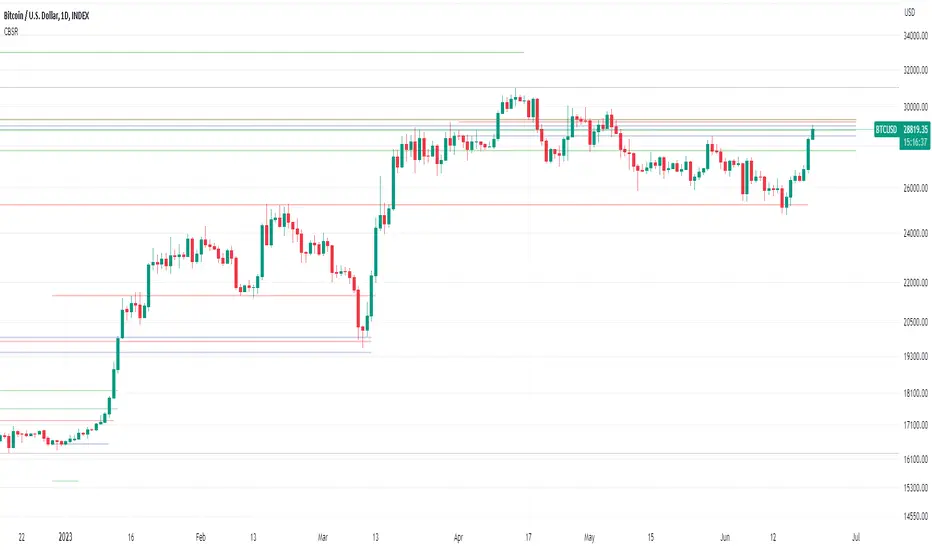
This script uses higher timeframe candle's High, Low & Close as a source for drawing a line representing potential Supports and Resistances.
The more lines you see on a level, probably the more important that level is.
The script has a single input for setting the source candle's timeframe, so it can be used on any timeframe with the proper settings. For example, higher timeframes like weekly and monthly can use "3M" or "12M" settings, Daily timeframes with "W", or even lower timeframes like minutes and seconds with "240" and "60" (M means monthly candle, W is weekly, and numbers are for minutes.)
As you can see on the code:
Give it a try on different timeframes with different settings to see interesting gaps between lines!
The more lines you see on a level, probably the more important that level is.
The script has a single input for setting the source candle's timeframe, so it can be used on any timeframe with the proper settings. For example, higher timeframes like weekly and monthly can use "3M" or "12M" settings, Daily timeframes with "W", or even lower timeframes like minutes and seconds with "240" and "60" (M means monthly candle, W is weekly, and numbers are for minutes.)
As you can see on the code:
- Red lines represent candle's High.
- Green lines represent candle's Low.
- Blue lines represent candle's Close.
Give it a try on different timeframes with different settings to see interesting gaps between lines!
오픈 소스 스크립트
트레이딩뷰의 진정한 정신에 따라, 이 스크립트의 작성자는 이를 오픈소스로 공개하여 트레이더들이 기능을 검토하고 검증할 수 있도록 했습니다. 작성자에게 찬사를 보냅니다! 이 코드는 무료로 사용할 수 있지만, 코드를 재게시하는 경우 하우스 룰이 적용된다는 점을 기억하세요.
면책사항
해당 정보와 게시물은 금융, 투자, 트레이딩 또는 기타 유형의 조언이나 권장 사항으로 간주되지 않으며, 트레이딩뷰에서 제공하거나 보증하는 것이 아닙니다. 자세한 내용은 이용 약관을 참조하세요.
오픈 소스 스크립트
트레이딩뷰의 진정한 정신에 따라, 이 스크립트의 작성자는 이를 오픈소스로 공개하여 트레이더들이 기능을 검토하고 검증할 수 있도록 했습니다. 작성자에게 찬사를 보냅니다! 이 코드는 무료로 사용할 수 있지만, 코드를 재게시하는 경우 하우스 룰이 적용된다는 점을 기억하세요.
면책사항
해당 정보와 게시물은 금융, 투자, 트레이딩 또는 기타 유형의 조언이나 권장 사항으로 간주되지 않으며, 트레이딩뷰에서 제공하거나 보증하는 것이 아닙니다. 자세한 내용은 이용 약관을 참조하세요.