INVITE-ONLY SCRIPT
PbF
What kind of traders/investors are we?
We are trend followers, always on the lookout for the next big move in the market. Our scripts are meticulously crafted for higher timeframes (daily, weekly, monthly) aiming to capture the large market trends.
What does the PbF script do?
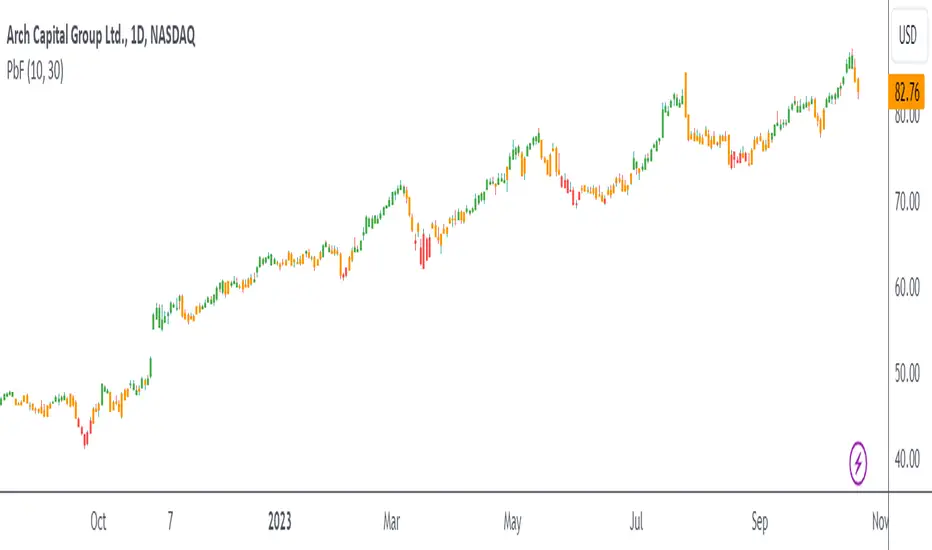
The PbF script simplifies the complex world of investing by colour-coding bars to indicate the trend direction. Green bars signify a bullish trend, red indicates a bearish trend, and orange is a precursor to potential pullback opportunities. This visual representation ensures investors can quickly gauge the market's direction and act accordingly.
How is the PbF produced?
The PbF script employs simple moving averages (SMA) as its backbone. Bars positioned above both the SMAs turn green, indicating a bullish trend. Conversely, bars below these SMAs turn red, signalling a bearish trend. When a bar oscillates between the SMAs, it turns orange, hinting at a potential pullback scenario.
What is the best timeframe to use the script?
The PbF script is designed for the weekly timeframe. By focusing on this timeframe, traders can pinpoint pullback positions, ensuring they are in sync with long-term market trends.
What makes the PbF script unique?
The challenges of identifying the onset, progression, and culmination of trends are well-known in the investing community. The PbF script addresses these challenges head-on.
First and foremost:
Designed explicitly for the weekly timeframe, the PbF also offers investors:
In essence, the PbF script is a trend filter that ensures investors remain aligned with long-term market trends, capitalising on pullbacks as the trend develops.
We are trend followers, always on the lookout for the next big move in the market. Our scripts are meticulously crafted for higher timeframes (daily, weekly, monthly) aiming to capture the large market trends.
What does the PbF script do?
The PbF script simplifies the complex world of investing by colour-coding bars to indicate the trend direction. Green bars signify a bullish trend, red indicates a bearish trend, and orange is a precursor to potential pullback opportunities. This visual representation ensures investors can quickly gauge the market's direction and act accordingly.
How is the PbF produced?
The PbF script employs simple moving averages (SMA) as its backbone. Bars positioned above both the SMAs turn green, indicating a bullish trend. Conversely, bars below these SMAs turn red, signalling a bearish trend. When a bar oscillates between the SMAs, it turns orange, hinting at a potential pullback scenario.
What is the best timeframe to use the script?
The PbF script is designed for the weekly timeframe. By focusing on this timeframe, traders can pinpoint pullback positions, ensuring they are in sync with long-term market trends.
What makes the PbF script unique?
The challenges of identifying the onset, progression, and culmination of trends are well-known in the investing community. The PbF script addresses these challenges head-on.
First and foremost:
- The PbF remains orange during extended periods of pullbacks and will only change colour when the pullback has ended.
- The filter also highlights an earlier entry from the previous bar if the market continues to pull back against the long-term trend, allowing you to adjust your entry as required.
Designed explicitly for the weekly timeframe, the PbF also offers investors:
- A clear roadmap to discern the beginning, middle, and end of market trends.
- The flexibility to exercise discretion when entering pullback positions.
In essence, the PbF script is a trend filter that ensures investors remain aligned with long-term market trends, capitalising on pullbacks as the trend develops.
초대 전용 스크립트
이 스크립트는 작성자가 승인한 사용자만 접근할 수 있습니다. 사용하려면 요청 후 승인을 받아야 하며, 일반적으로 결제 후에 허가가 부여됩니다. 자세한 내용은 아래 작성자의 안내를 따르거나 Sublime_Trading에게 직접 문의하세요.
트레이딩뷰는 스크립트의 작동 방식을 충분히 이해하고 작성자를 완전히 신뢰하지 않는 이상, 해당 스크립트에 비용을 지불하거나 사용하는 것을 권장하지 않습니다. 커뮤니티 스크립트에서 무료 오픈소스 대안을 찾아보실 수도 있습니다.
작성자 지시 사항
This is a tool for Sublime Trading community members only. If you DM us your email, we will send you details on joining the community.
Join Our Private Community
bit.ly/join-ST-community
Plus Get Our Ultimate Stock Market Blueprint.
bit.ly/join-ST-community
Plus Get Our Ultimate Stock Market Blueprint.
면책사항
해당 정보와 게시물은 금융, 투자, 트레이딩 또는 기타 유형의 조언이나 권장 사항으로 간주되지 않으며, 트레이딩뷰에서 제공하거나 보증하는 것이 아닙니다. 자세한 내용은 이용 약관을 참조하세요.