OPEN-SOURCE SCRIPT
업데이트됨 Previous Day Levels (High, Low, Open, Close)
This TradingView Pine Script indicator plots the previous day’s price levels (High, Low, Open, and Close) as horizontal rays that extend across the current trading day.
Green lines mark the Previous Day High and Previous Day Low.
Yellow lines mark the Previous Day Open and Previous Day Close.
Labels are automatically displayed at the right edge of the chart, positioned above each line, making it easy to identify the corresponding level in real time.
The levels are updated daily and always begin at the start of the current day, ensuring that they cover the entire intraday session.
This tool helps traders quickly visualize key support and resistance levels from the previous trading day and incorporate them into intraday strategies.
릴리즈 노트
This TradingView Pine Script indicator plots the previous day’s price levels (High, Low, Open, and Close) as horizontal rays that extend across the current trading day.Green lines mark the Previous Day High and Previous Day Low.
Yellow lines mark the Previous Day Open and Previous Day Close.
Labels are automatically displayed at the right edge of the chart, positioned above each line, making it easy to identify the corresponding level in real time.
The levels are updated daily and always begin at the start of the current day, ensuring that they cover the entire intraday session.
This tool helps traders quickly visualize key support and resistance levels from the previous trading day and incorporate them into intraday strategies.
릴리즈 노트
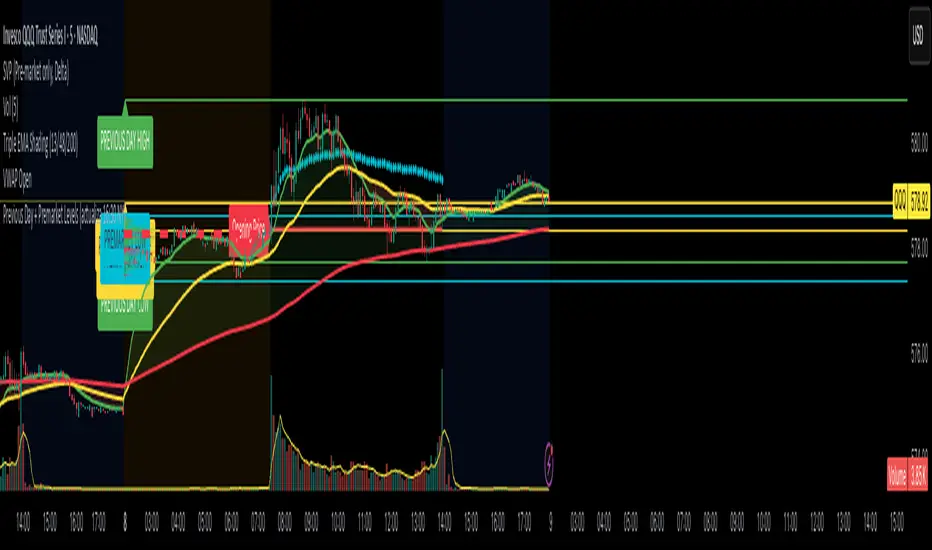
This TradingView Pine Script indicator automatically plots key price levels from the previous trading day and the pre‑market session on intraday charts.Previous Day Levels
High and Low → Green horizontal rays
Open and Close → Yellow horizontal rays
Pre‑Market Levels (04:00 – 09:30 New York time)
High and Low → Aqua (light blue) horizontal rays
All levels extend across the entire current trading day, making them easy to reference during live trading.
Labels are displayed at the beginning of each line, clearly identifying whether the level corresponds to the previous day or the pre‑market session.
This tool helps traders quickly identify and track important support and resistance zones from both the previous day and the pre‑market, which are often respected during regular trading hours.
릴리즈 노트
This indicator automatically plots the key previous day levels and premarket levels on your chart, aligned with New York trading hours.🔹 Main Features
Previous Day Levels
High, Low, Open, and Close.
These levels update right after the regular session ends at 4:30 pm NY, and remain fixed throughout the extended session and the following premarket.
Premarket Levels (04:00–09:30 NY)
Premarket High.
Premarket Low.
Calculated dynamically during premarket trading hours.
Visual Representation
Horizontal lines extended to the right for each level.
Labels attached at the start of each line for clarity (PREVIOUS DAY HIGH, PREMARKET LOW, etc.).
Color-coded lines:
Yellow = Previous Day Open/Close
Green = Previous Day High/Low
Aqua = Premarket High/Low
🔹 Update Logic
From 4:30 pm to 9:29 am NY → "Previous Day" levels are based on the just-closed trading day.
From 9:30 am to 4:29 pm NY → "Previous Day" levels reflect the prior day.
This ensures levels are available immediately after the session close, not delayed until the next day’s market open.
오픈 소스 스크립트
트레이딩뷰의 진정한 정신에 따라, 이 스크립트의 작성자는 이를 오픈소스로 공개하여 트레이더들이 기능을 검토하고 검증할 수 있도록 했습니다. 작성자에게 찬사를 보냅니다! 이 코드는 무료로 사용할 수 있지만, 코드를 재게시하는 경우 하우스 룰이 적용된다는 점을 기억하세요.
면책사항
해당 정보와 게시물은 금융, 투자, 트레이딩 또는 기타 유형의 조언이나 권장 사항으로 간주되지 않으며, 트레이딩뷰에서 제공하거나 보증하는 것이 아닙니다. 자세한 내용은 이용 약관을 참조하세요.
오픈 소스 스크립트
트레이딩뷰의 진정한 정신에 따라, 이 스크립트의 작성자는 이를 오픈소스로 공개하여 트레이더들이 기능을 검토하고 검증할 수 있도록 했습니다. 작성자에게 찬사를 보냅니다! 이 코드는 무료로 사용할 수 있지만, 코드를 재게시하는 경우 하우스 룰이 적용된다는 점을 기억하세요.
면책사항
해당 정보와 게시물은 금융, 투자, 트레이딩 또는 기타 유형의 조언이나 권장 사항으로 간주되지 않으며, 트레이딩뷰에서 제공하거나 보증하는 것이 아닙니다. 자세한 내용은 이용 약관을 참조하세요.