OPEN-SOURCE SCRIPT
Custom Support & Resistance Levels
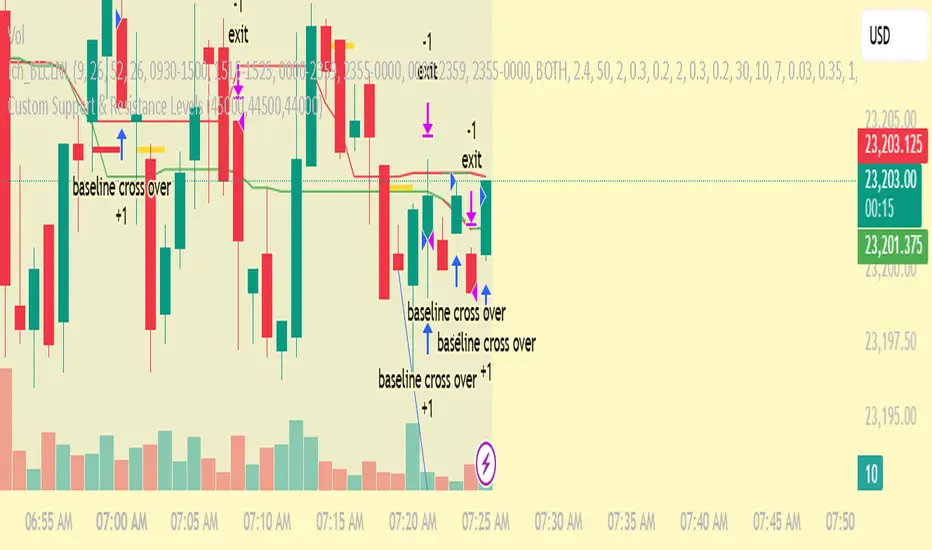
The Smart Auto Trendline Indicator is designed to help traders quickly identify key market trends without the need for manual drawing. It automatically detects swing highs and lows, plots dynamic trendlines, and updates them in real-time as price evolves.
This tool is especially useful for traders who rely on trendline breakouts, pullback entries, or reversal confirmations. By simplifying chart analysis, it saves time and ensures more consistent results.
Key Features:
🔹 Automatic detection of valid swing highs and lows
🔹 Dynamic trendline plotting (auto-adjusts as price moves)
🔹 Highlights potential breakout and breakdown zones
🔹 Works on all timeframes and instruments (Forex, Stocks, Indices, Crypto)
🔹 Clean, non-intrusive design to keep charts clear
🔹 Customizable settings (line color, style, sensitivity)
How to Use:
Apply the indicator to your chart.
Observe automatically drawn trendlines.
Watch for breakouts above/below trendlines for trade entries.
Use in combination with other tools like RSI, MACD, or support/resistance for stronger confirmation.
Best For:
Breakout traders
Swing traders
Trend followers
Forex, Stocks, Crypto, Indices
오픈 소스 스크립트
트레이딩뷰의 진정한 정신에 따라, 이 스크립트의 작성자는 이를 오픈소스로 공개하여 트레이더들이 기능을 검토하고 검증할 수 있도록 했습니다. 작성자에게 찬사를 보냅니다! 이 코드는 무료로 사용할 수 있지만, 코드를 재게시하는 경우 하우스 룰이 적용된다는 점을 기억하세요.
면책사항
해당 정보와 게시물은 금융, 투자, 트레이딩 또는 기타 유형의 조언이나 권장 사항으로 간주되지 않으며, 트레이딩뷰에서 제공하거나 보증하는 것이 아닙니다. 자세한 내용은 이용 약관을 참조하세요.
오픈 소스 스크립트
트레이딩뷰의 진정한 정신에 따라, 이 스크립트의 작성자는 이를 오픈소스로 공개하여 트레이더들이 기능을 검토하고 검증할 수 있도록 했습니다. 작성자에게 찬사를 보냅니다! 이 코드는 무료로 사용할 수 있지만, 코드를 재게시하는 경우 하우스 룰이 적용된다는 점을 기억하세요.
면책사항
해당 정보와 게시물은 금융, 투자, 트레이딩 또는 기타 유형의 조언이나 권장 사항으로 간주되지 않으며, 트레이딩뷰에서 제공하거나 보증하는 것이 아닙니다. 자세한 내용은 이용 약관을 참조하세요.