OPEN-SOURCE SCRIPT
Fibonacci Moving Average
Simple idea from an article I read online I decided to code:
Take EMA's for periods based on the fibonacci sequence - 3, 5, 8, 13, 21, 34, 55 etc. and average them into one MA - the result is the Fibonacci MA (FMA)
Therefore - note the FMA does not use Length - but Range/Interval of how many steps of the Fibonacci Sequence to include.
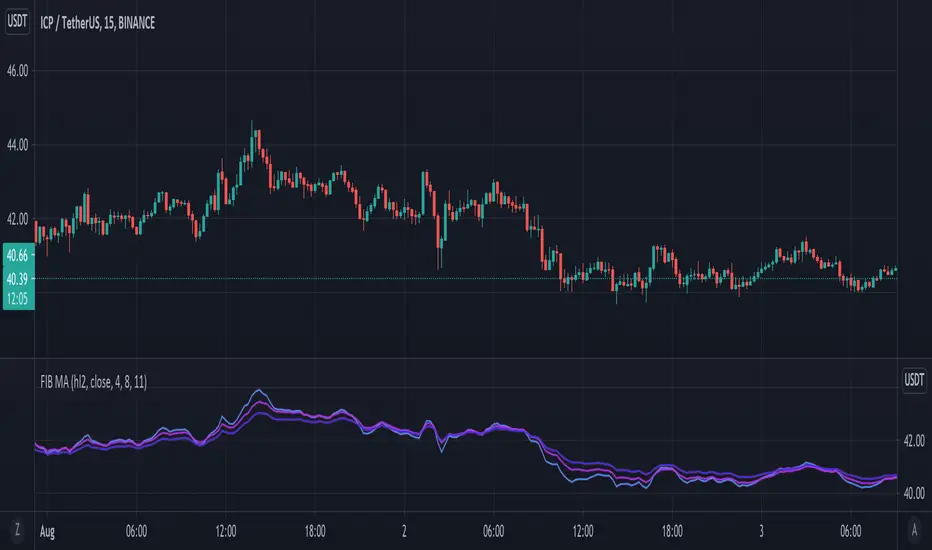
Seems to be good for finding support/resistance for the price - so added some extra features:
Using up to 3 in at different periods - when they stretch apart it means price is very deviated and will reverse.
Added a price OHLC line if you want to move the indicator to a sub-panel for nice visualisation.
I believe you could look at the 4, 8 and 10, where the longest MA (10,11 FMA) indicates overall bull or bear trend (whether on top or bottom) and you could probably code in alerts for price crossing up or crossing down on the faster (4 FMA)
Take EMA's for periods based on the fibonacci sequence - 3, 5, 8, 13, 21, 34, 55 etc. and average them into one MA - the result is the Fibonacci MA (FMA)
Therefore - note the FMA does not use Length - but Range/Interval of how many steps of the Fibonacci Sequence to include.
Seems to be good for finding support/resistance for the price - so added some extra features:
Using up to 3 in at different periods - when they stretch apart it means price is very deviated and will reverse.
Added a price OHLC line if you want to move the indicator to a sub-panel for nice visualisation.
I believe you could look at the 4, 8 and 10, where the longest MA (10,11 FMA) indicates overall bull or bear trend (whether on top or bottom) and you could probably code in alerts for price crossing up or crossing down on the faster (4 FMA)
오픈 소스 스크립트
트레이딩뷰의 진정한 정신에 따라, 이 스크립트의 작성자는 이를 오픈소스로 공개하여 트레이더들이 기능을 검토하고 검증할 수 있도록 했습니다. 작성자에게 찬사를 보냅니다! 이 코드는 무료로 사용할 수 있지만, 코드를 재게시하는 경우 하우스 룰이 적용된다는 점을 기억하세요.
면책사항
해당 정보와 게시물은 금융, 투자, 트레이딩 또는 기타 유형의 조언이나 권장 사항으로 간주되지 않으며, 트레이딩뷰에서 제공하거나 보증하는 것이 아닙니다. 자세한 내용은 이용 약관을 참조하세요.
오픈 소스 스크립트
트레이딩뷰의 진정한 정신에 따라, 이 스크립트의 작성자는 이를 오픈소스로 공개하여 트레이더들이 기능을 검토하고 검증할 수 있도록 했습니다. 작성자에게 찬사를 보냅니다! 이 코드는 무료로 사용할 수 있지만, 코드를 재게시하는 경우 하우스 룰이 적용된다는 점을 기억하세요.
면책사항
해당 정보와 게시물은 금융, 투자, 트레이딩 또는 기타 유형의 조언이나 권장 사항으로 간주되지 않으며, 트레이딩뷰에서 제공하거나 보증하는 것이 아닙니다. 자세한 내용은 이용 약관을 참조하세요.