OPEN-SOURCE SCRIPT
[MAD] Gaussian silence detector
Based on a short experiments a Gaussian silence detector
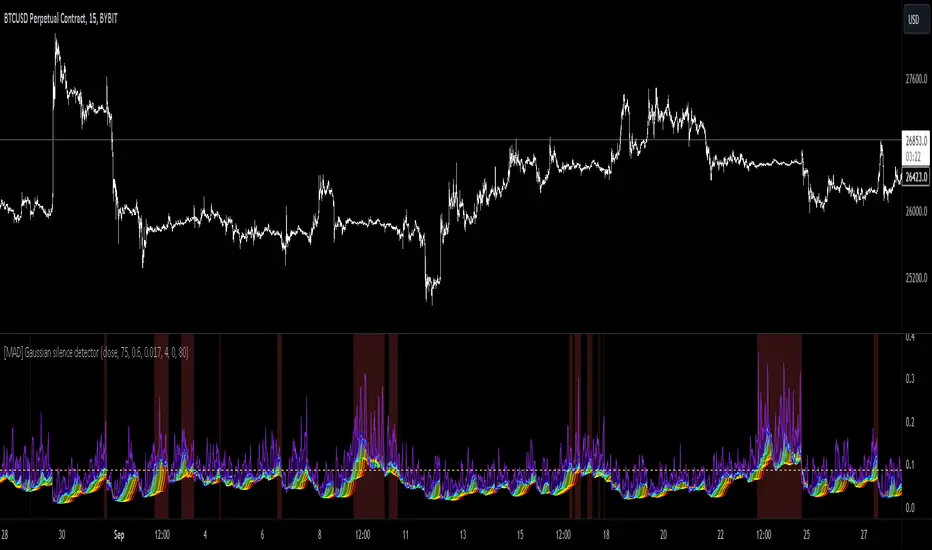
This script utilizes a Gaussian distribution function to visualize price volatility and potential major movement moments in trading.
Dynamic Spectrum Visualization:
The script plots ten different levels of the Gaussian distribution, each represented by a different color ranging from red to violet. This provides a spectrum view of the price data.
Adjustable Alert Levels:
Users can set a specific alert level, and when more than four Gaussian values exceed this threshold, a breakout alert is triggered.
Customizable Display Settings:
The visual compression, transparency, and color scheme can be adjusted to cater to different charting preferences.
Background Highlighting:
Whenever a potential breakout scenario is detected, the chart's background changes color, allowing for quick visual reference.
--------------
How to Use the Indicator
Adjust Deviation & Alert Levels:
First things first, play around with the deviation setting. This is going to help the tool understand the market's 'normal' behavior.
Next, tweak the alert levels. You want the background color to switch effectively during periods of silence. This is based on past data, so look at how the chart behaved historically and adjust accordingly.
For now each timeframe needs its own setup.
Set Up The Colors:
Once you've got the basics down, dive into the color settings. This doesn't affect how the tool works; it just makes things look prettier (or uglier, depending on your color choices 😜).
Compression (Optional):
If you think the data display is too intense or too mellow, adjust the compression. This won't change the calculations.
It's just about how you view the data.
Remember to combine it with other trading strategies and tools for the best results.
오픈 소스 스크립트
진정한 트레이딩뷰 정신에 따라 이 스크립트 작성자는 트레이더가 기능을 검토하고 검증할 수 있도록 오픈소스로 공개했습니다. 작성자에게 찬사를 보냅니다! 무료로 사용할 수 있지만 코드를 다시 게시할 경우 하우스 룰이 적용된다는 점을 기억하세요.
면책사항
이 정보와 게시물은 TradingView에서 제공하거나 보증하는 금융, 투자, 거래 또는 기타 유형의 조언이나 권고 사항을 의미하거나 구성하지 않습니다. 자세한 내용은 이용 약관을 참고하세요.
오픈 소스 스크립트
진정한 트레이딩뷰 정신에 따라 이 스크립트 작성자는 트레이더가 기능을 검토하고 검증할 수 있도록 오픈소스로 공개했습니다. 작성자에게 찬사를 보냅니다! 무료로 사용할 수 있지만 코드를 다시 게시할 경우 하우스 룰이 적용된다는 점을 기억하세요.
면책사항
이 정보와 게시물은 TradingView에서 제공하거나 보증하는 금융, 투자, 거래 또는 기타 유형의 조언이나 권고 사항을 의미하거나 구성하지 않습니다. 자세한 내용은 이용 약관을 참고하세요.