PROTECTED SOURCE SCRIPT
Cross-Asset Risk Appetite Index
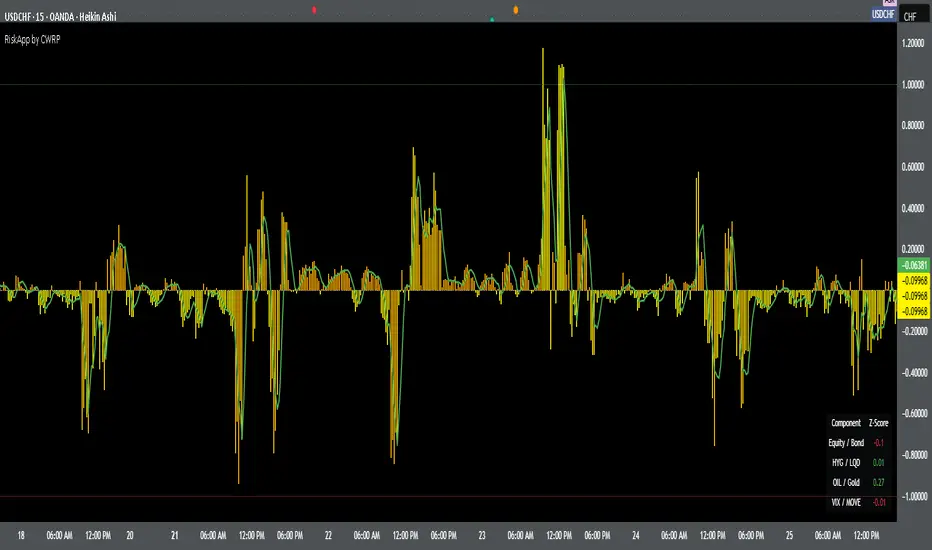
Cross-Asset Risk Appetite Index (RiskApp) by CWRP combines multiple asset classes into a single risk sentiment signal to help traders and investors detect when the market is in a risk-on or risk-off regime.
It calculates a composite Z-score index based on relative performance between:
SPY / IEF: Equities vs Bonds
HYG / LQD: High Yield vs Investment Grade Credit
CL / GC: Oil vs Gold
VIX / MOVE: Equity vs Bond Market Volatility (inverted)
Each component reflects capital flows toward riskier or safer assets, with dynamic weighting (Equity/Bond: 30%, Credit: 25%, Commodities: 25%, Volatility: 20%) and smoothing applied for a cleaner signal.
How to Read:
Highlighting
Yellow = Risk-On sentiment (market favors risk assets)
Orange = Risk-Off sentiment (flight to safety)
Black Background = Neutral design for emotional detachment
Table
Equity/Bond Z-Score:
Positive (> +1) --> Stocks outperforming bonds --> Risk-On
Negative (< -1) --> Bonds outperforming stocks --> Risk-Off
Credit Spread Z-Score (HYG/LQD):
Positive --> High yield outperforming --> Investors seeking yield
Negative --> Flight to quality --> Credit concerns
Oil/Gold Z-Score:
Positive --> Oil outperforming --> Economic optimism
Negative --> Gold outperforming --> Defensive positioning
Volatility Spread (VIX/MOVE):
Positive --> Equity vol falling relative to bond vol --> Risk stabilizing
Negative --> Equity vol rising --> Caution / Risk-Off
Composite Index:
> +1 --> Strong Risk Appetite
< -1 --> Strong Risk Aversion
Between -1 and +1 --> Neutral regime
Thank you for using the Cross-Asset Risk Appetite Index by CWRP!
I'm open to all critiques and discussion around macro-finance and hope this model adds clarity to your decision-making.
보호된 스크립트입니다
이 스크립트는 비공개 소스로 게시됩니다. 하지만 이를 자유롭게 제한 없이 사용할 수 있습니다 – 자세한 내용은 여기에서 확인하세요.
면책사항
해당 정보와 게시물은 금융, 투자, 트레이딩 또는 기타 유형의 조언이나 권장 사항으로 간주되지 않으며, 트레이딩뷰에서 제공하거나 보증하는 것이 아닙니다. 자세한 내용은 이용 약관을 참조하세요.
면책사항
해당 정보와 게시물은 금융, 투자, 트레이딩 또는 기타 유형의 조언이나 권장 사항으로 간주되지 않으며, 트레이딩뷰에서 제공하거나 보증하는 것이 아닙니다. 자세한 내용은 이용 약관을 참조하세요.