OPEN-SOURCE SCRIPT
Cumulative Force Oscillator with MACD
Cumulative Force Oscillator with MACD
The Cumulative Force Oscillator with MACD is an advanced technical indicator designed to provide traders with a unique perspective on market momentum and trend strength. By combining the power of cumulative candle force analysis with MACD crossover signals, this indicator offers a multifaceted approach to market analysis.
Key Features
1. Cumulative Force Calculation**: Measures the net force of price movements over a specified number of candles.
2. MACD Integration**: Incorporates MACD crossover signals for additional trend confirmation.
3. Visual Cues**: Utilizes color-coded oscillator lines and background zones for easy interpretation.
4. **Dynamic Labeling**: Displays real-time force values and percentage changes.
How It Works
Cumulative Force Calculation
The indicator calculates the "force" of each candle by subtracting the open price from the close price. It then sums this force over a user-defined number of candles to create a cumulative force value. This value oscillates above and below zero, indicating bullish or bearish pressure respectively.
MACD Crossover Detection
The indicator uses the standard MACD (12, 26, 9) to detect bullish and bearish crossovers. These crossovers are visually represented by colored background zones, providing an additional layer of trend confirmation.
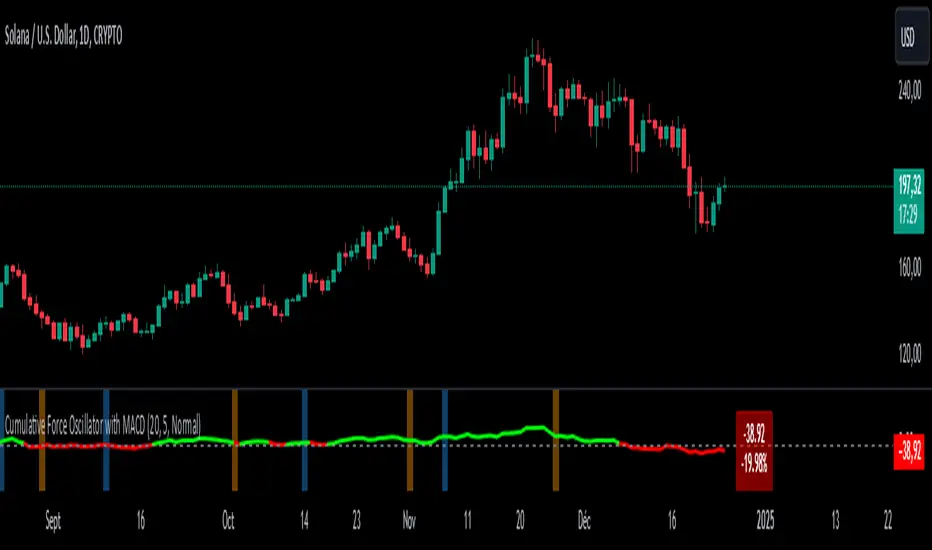
Visual Representation
- The main oscillator line is plotted in green when above zero (bullish) and red when below zero (bearish).
- Background colors change based on MACD crossovers: light blue for bullish crossovers and light orange for bearish crossovers.
- A dynamic label displays the current cumulative force value and its percentage change from the previous period.
Interpretation
1. Oscillator Line : When the line is above zero, it indicates net bullish pressure; below zero suggests net bearish pressure.
2. Oscillator Momentum : The steepness and direction of the oscillator line indicate the strength and direction of the current market force.
3. MACD Crossovers : Blue background zones suggest potential bullish trends, while orange zones indicate potential bearish trends.
4. Divergences : Look for divergences between the oscillator and price action for potential trend reversal signals.
Customization
Users can customize several aspects of the indicator :
- Number of candles for force calculation
- Label offset and text size
- Color schemes (through code modification)
Conclusion
The Cumulative Force Oscillator with MACD is a versatile tool that combines momentum analysis with trend confirmation signals. By providing a visual representation of cumulative market force alongside MACD crossovers, it offers traders a comprehensive view of market dynamics. This indicator can be particularly useful for identifying potential trend reversals, confirming existing trends, and gauging overall market strength.
The Cumulative Force Oscillator with MACD is an advanced technical indicator designed to provide traders with a unique perspective on market momentum and trend strength. By combining the power of cumulative candle force analysis with MACD crossover signals, this indicator offers a multifaceted approach to market analysis.
Key Features
1. Cumulative Force Calculation**: Measures the net force of price movements over a specified number of candles.
2. MACD Integration**: Incorporates MACD crossover signals for additional trend confirmation.
3. Visual Cues**: Utilizes color-coded oscillator lines and background zones for easy interpretation.
4. **Dynamic Labeling**: Displays real-time force values and percentage changes.
How It Works
Cumulative Force Calculation
The indicator calculates the "force" of each candle by subtracting the open price from the close price. It then sums this force over a user-defined number of candles to create a cumulative force value. This value oscillates above and below zero, indicating bullish or bearish pressure respectively.
MACD Crossover Detection
The indicator uses the standard MACD (12, 26, 9) to detect bullish and bearish crossovers. These crossovers are visually represented by colored background zones, providing an additional layer of trend confirmation.
Visual Representation
- The main oscillator line is plotted in green when above zero (bullish) and red when below zero (bearish).
- Background colors change based on MACD crossovers: light blue for bullish crossovers and light orange for bearish crossovers.
- A dynamic label displays the current cumulative force value and its percentage change from the previous period.
Interpretation
1. Oscillator Line : When the line is above zero, it indicates net bullish pressure; below zero suggests net bearish pressure.
2. Oscillator Momentum : The steepness and direction of the oscillator line indicate the strength and direction of the current market force.
3. MACD Crossovers : Blue background zones suggest potential bullish trends, while orange zones indicate potential bearish trends.
4. Divergences : Look for divergences between the oscillator and price action for potential trend reversal signals.
Customization
Users can customize several aspects of the indicator :
- Number of candles for force calculation
- Label offset and text size
- Color schemes (through code modification)
Conclusion
The Cumulative Force Oscillator with MACD is a versatile tool that combines momentum analysis with trend confirmation signals. By providing a visual representation of cumulative market force alongside MACD crossovers, it offers traders a comprehensive view of market dynamics. This indicator can be particularly useful for identifying potential trend reversals, confirming existing trends, and gauging overall market strength.
오픈 소스 스크립트
트레이딩뷰의 진정한 정신에 따라, 이 스크립트의 작성자는 이를 오픈소스로 공개하여 트레이더들이 기능을 검토하고 검증할 수 있도록 했습니다. 작성자에게 찬사를 보냅니다! 이 코드는 무료로 사용할 수 있지만, 코드를 재게시하는 경우 하우스 룰이 적용된다는 점을 기억하세요.
면책사항
해당 정보와 게시물은 금융, 투자, 트레이딩 또는 기타 유형의 조언이나 권장 사항으로 간주되지 않으며, 트레이딩뷰에서 제공하거나 보증하는 것이 아닙니다. 자세한 내용은 이용 약관을 참조하세요.
오픈 소스 스크립트
트레이딩뷰의 진정한 정신에 따라, 이 스크립트의 작성자는 이를 오픈소스로 공개하여 트레이더들이 기능을 검토하고 검증할 수 있도록 했습니다. 작성자에게 찬사를 보냅니다! 이 코드는 무료로 사용할 수 있지만, 코드를 재게시하는 경우 하우스 룰이 적용된다는 점을 기억하세요.
면책사항
해당 정보와 게시물은 금융, 투자, 트레이딩 또는 기타 유형의 조언이나 권장 사항으로 간주되지 않으며, 트레이딩뷰에서 제공하거나 보증하는 것이 아닙니다. 자세한 내용은 이용 약관을 참조하세요.