OPEN-SOURCE SCRIPT
업데이트됨 Liquidity Optimal Lag
1.0.
릴리즈 노트
This script is designed to assess the impact of liquidity from Federal Reserve operations on asset prices, allowing for customizable weightings and analysis of correlations between liquidity factors and selected assets like Bitcoin (BTC), Ethereum (ETH), or Solana (SOL). The primary objective is to understand how different liquidity inputs affect the price of these assets and to visualize correlations over time with adjustable settings.Key Features:
1. Liquidity Calculation with Adjustable Weightings:
- The script pulls data from the Federal Reserve's balance sheet and other relevant liquidity sources such as the Treasury General Account (TGA), Reverse Repo Payments (RRP), Bank Term Funding Program (BTFP), and the Discount Window.
- Users can experiment with different weightings for each liquidity factor, allowing for flexibility in how each component contributes to overall liquidity.
- The final liquidity figure is normalized for better comparison and can be offset by a user-defined period for improved lag analysis.
2. Correlation and Statistical Analysis:
- The script calculates the correlation (`r`) between the selected asset's price (BTC, ETH, or SOL) and the offset liquidity data over a customizable correlation period.
- Additionally, the R-squared (`r²`) value is computed to measure the strength of the relationship between liquidity and asset prices.
- Smoothing can be applied to the correlation data using a simple moving average (SMA), and both the raw and smoothed correlation values are plotted.
3. Customizable Inputs:
- Asset Selection: Choose between Bitcoin (BTC), Ethereum (ETH), or Solana (SOL) to compare their prices against the liquidity data.
- Weighting: Adjust weightings for the Fed Balance Sheet, TGA, RRP, BTFP, and Discount Window to experiment with how each liquidity source impacts the overall calculation.
- Correlation Settings: Fine-tune the correlation analysis using adjustable periods, smoothing, and an offset for liquidity.
- Display Options: Toggle the visibility of Net Fed Liquidity, Correlation, and Average Correlation on the chart.
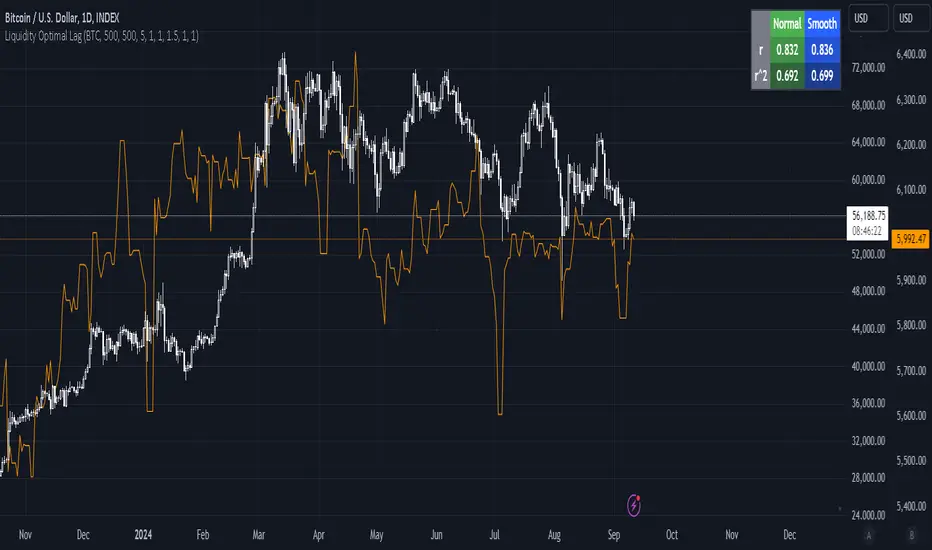
4. Visual Representation:
- The script plots the following on the chart:
- Net Fed Liquidity: The offset and normalized liquidity value.
- Correlation: The correlation coefficient between liquidity and the asset price.
- Average Correlation: A smoothed version of the correlation using a moving average.
- A table in the top-right corner displays the real-time and average correlation (`r`) and R-squared (`r²`) values for easier interpretation.
This tool is ideal for traders and analysts interested in understanding the lag effect of liquidity on asset prices and experimenting with various liquidity weightings to find the optimal configuration.
릴리즈 노트
3.0오픈 소스 스크립트
트레이딩뷰의 진정한 정신에 따라, 이 스크립트의 작성자는 이를 오픈소스로 공개하여 트레이더들이 기능을 검토하고 검증할 수 있도록 했습니다. 작성자에게 찬사를 보냅니다! 이 코드는 무료로 사용할 수 있지만, 코드를 재게시하는 경우 하우스 룰이 적용된다는 점을 기억하세요.
면책사항
해당 정보와 게시물은 금융, 투자, 트레이딩 또는 기타 유형의 조언이나 권장 사항으로 간주되지 않으며, 트레이딩뷰에서 제공하거나 보증하는 것이 아닙니다. 자세한 내용은 이용 약관을 참조하세요.
오픈 소스 스크립트
트레이딩뷰의 진정한 정신에 따라, 이 스크립트의 작성자는 이를 오픈소스로 공개하여 트레이더들이 기능을 검토하고 검증할 수 있도록 했습니다. 작성자에게 찬사를 보냅니다! 이 코드는 무료로 사용할 수 있지만, 코드를 재게시하는 경우 하우스 룰이 적용된다는 점을 기억하세요.
면책사항
해당 정보와 게시물은 금융, 투자, 트레이딩 또는 기타 유형의 조언이나 권장 사항으로 간주되지 않으며, 트레이딩뷰에서 제공하거나 보증하는 것이 아닙니다. 자세한 내용은 이용 약관을 참조하세요.