PROTECTED SOURCE SCRIPT
업데이트됨 Vector Candles - By Blockhead
What this script does:
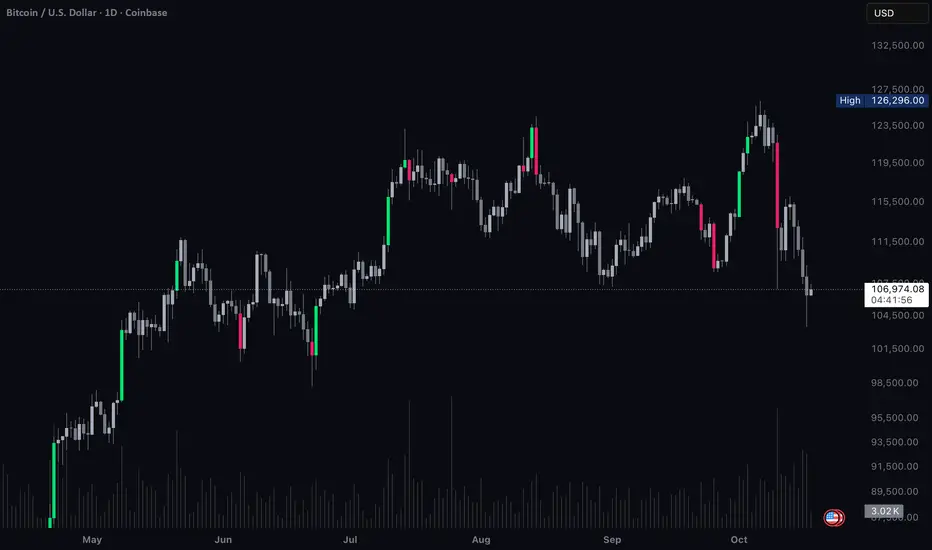
Vector Candles highlights moments of intense market participation by coloring “climax” candles — bars where trading activity surges beyond normal conditions. These colored candles make it easy to visualize bursts of liquidity, directional momentum, or exhaustion zones across any market.
⸻
How this script works:
The indicator scans each bar for abnormal behavior in volume and range expansion.
If volume exceeds 2× the 10-bar average or if volume × range reaches a short-term extreme, that candle is marked as a “climax” — lime for bullish momentum or red for bearish pressure.
This provides a clean, real-time visual of where institutional volume or aggressive participation enters the market.
⸻
How to use this script:
Apply Vector Candles to any chart to spot areas of heavy buying or selling interest.
Optionally, enable the “Override Chart Symbol” setting to pull data from a reference market (e.g., QQQ for tech stocks, DXY for gold, BTC index for altcoins).
This allows you to identify when a symbol’s move is part of a sector rotation, broader flow, or inverse correlation, rather than isolated price action.
⸻
What makes this script original:
Unlike traditional vector candle indicators, this version introduces a cross-symbol volume engine — letting you visualize climax activity from one market directly on another.
This unlocks a powerful new layer of contextual analysis, ideal for spotting rotations, correlation breaks, and macro-driven liquidity shifts in real time.
It’s not just about where momentum appears — it’s about where it originates.
릴리즈 노트
Updated screenshot보호된 스크립트입니다
이 스크립트는 비공개 소스로 게시됩니다. 하지만 이를 자유롭게 제한 없이 사용할 수 있습니다 – 자세한 내용은 여기에서 확인하세요.
면책사항
해당 정보와 게시물은 금융, 투자, 트레이딩 또는 기타 유형의 조언이나 권장 사항으로 간주되지 않으며, 트레이딩뷰에서 제공하거나 보증하는 것이 아닙니다. 자세한 내용은 이용 약관을 참조하세요.
보호된 스크립트입니다
이 스크립트는 비공개 소스로 게시됩니다. 하지만 이를 자유롭게 제한 없이 사용할 수 있습니다 – 자세한 내용은 여기에서 확인하세요.
면책사항
해당 정보와 게시물은 금융, 투자, 트레이딩 또는 기타 유형의 조언이나 권장 사항으로 간주되지 않으며, 트레이딩뷰에서 제공하거나 보증하는 것이 아닙니다. 자세한 내용은 이용 약관을 참조하세요.